Fig. 7
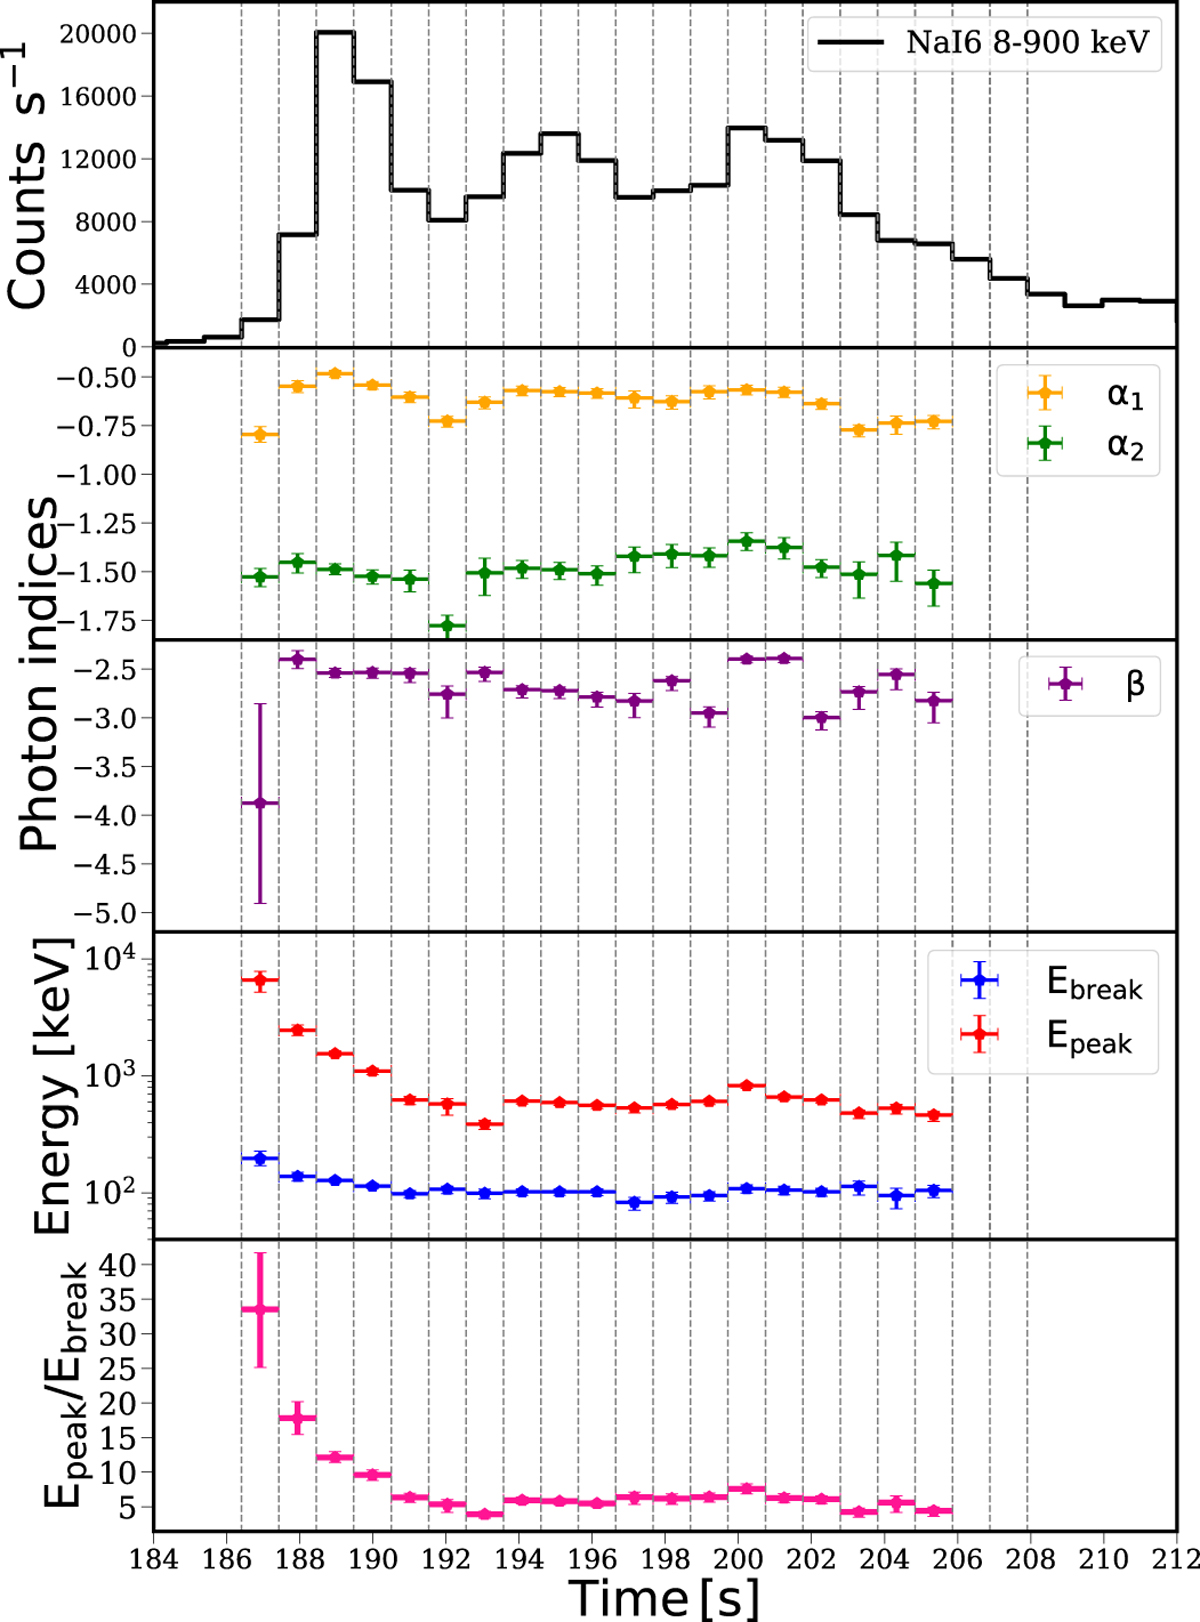
Time evolution of the spectral parameters of the 2SBPL model (Table B.1) for time-resolved spectra where the 2SBPL fit improves at more than 3σ the SBPL fit (all bins but the last two). From top to bottom: Count rate light curve (with 1.024 s time resolution), photon indices below and above the break (yellow and green symbols, respectively), spectral index above the peak energy (purple symbols), peak and break energy (red and blue symbols, respectively), and ratio between peak and break energy (pink symbols). For an explanation of the notation used for the 2SBPL parameters, see Fig. 2 (red line).
Current usage metrics show cumulative count of Article Views (full-text article views including HTML views, PDF and ePub downloads, according to the available data) and Abstracts Views on Vision4Press platform.
Data correspond to usage on the plateform after 2015. The current usage metrics is available 48-96 hours after online publication and is updated daily on week days.
Initial download of the metrics may take a while.