Free Access
Fig. A.1
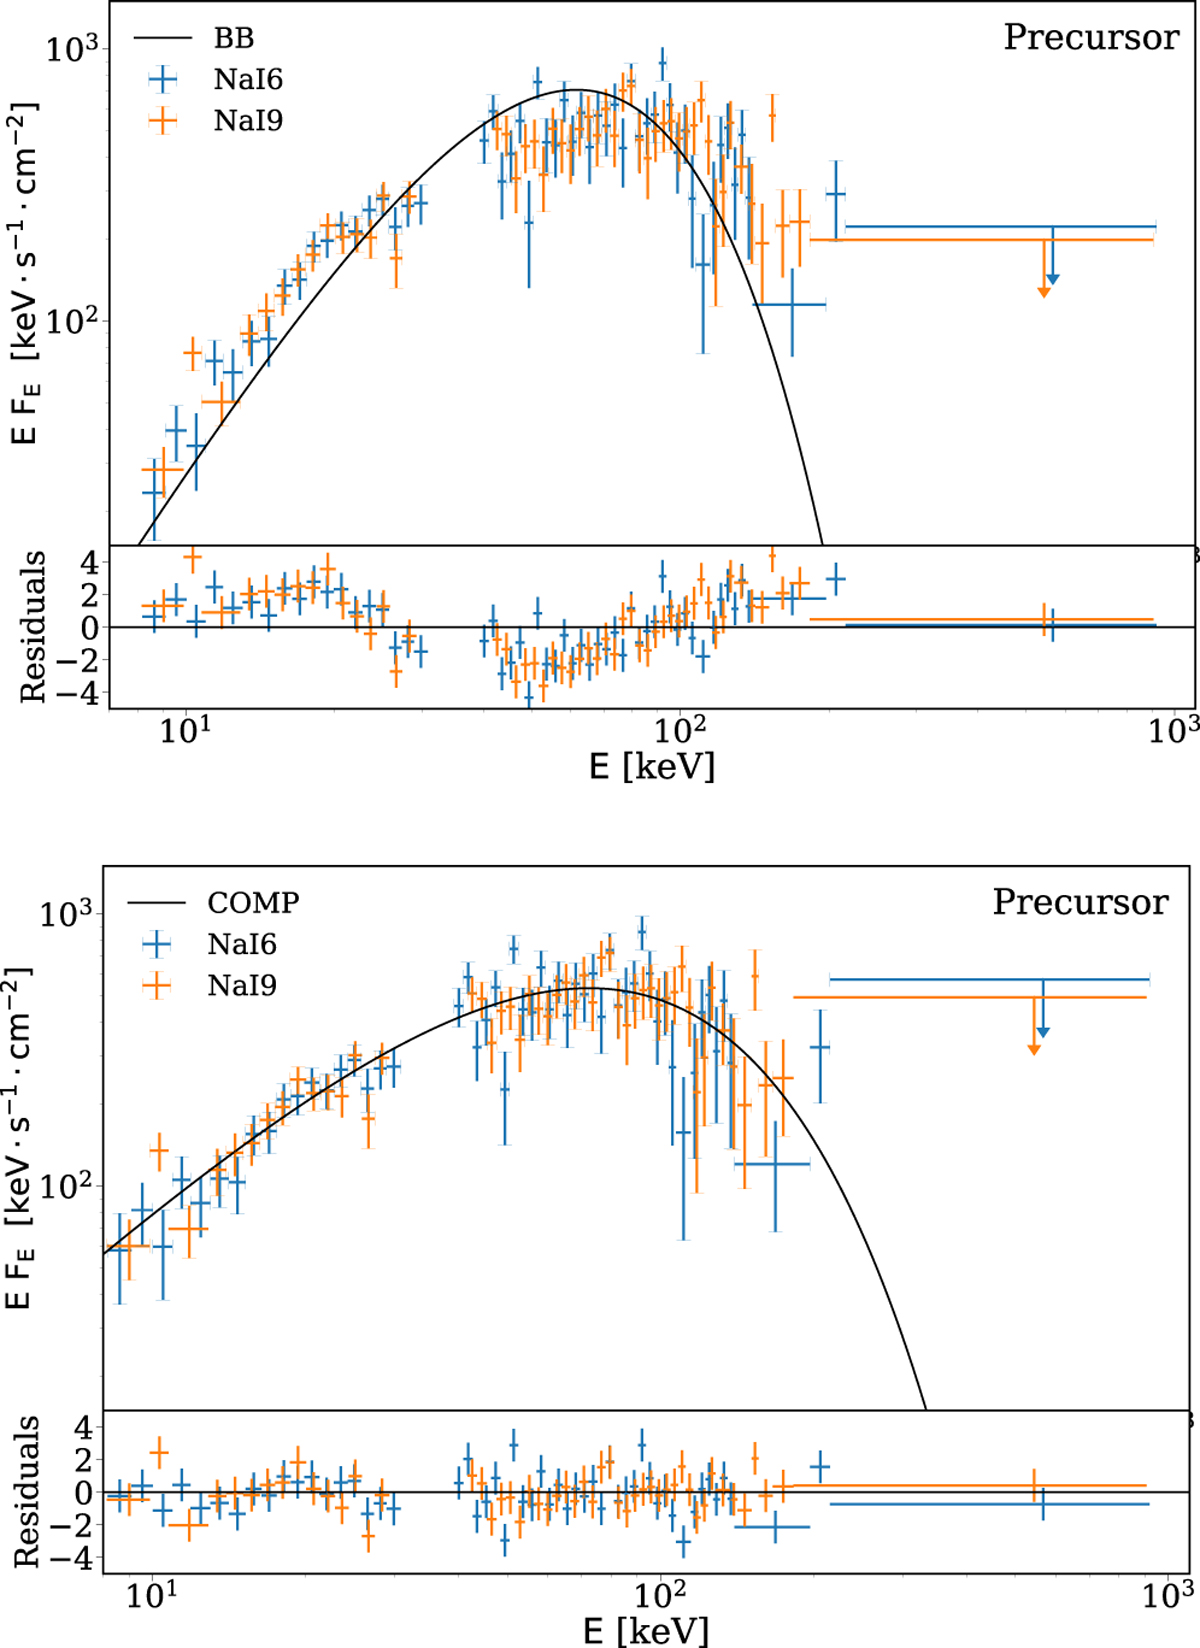
Toppanel: EFE spectrum of the precursor (0.002–1.056 s) fitted with a single BB (dotted line). Error bars on the data points denote the 1σ confidence level. The 3σ upper limits are shown with arrows. Residuals in units of σ are shown in the bottom stripe. Bottom panel: Same spectrum fitted with the CPL model.
Current usage metrics show cumulative count of Article Views (full-text article views including HTML views, PDF and ePub downloads, according to the available data) and Abstracts Views on Vision4Press platform.
Data correspond to usage on the plateform after 2015. The current usage metrics is available 48-96 hours after online publication and is updated daily on week days.
Initial download of the metrics may take a while.