Fig. 9
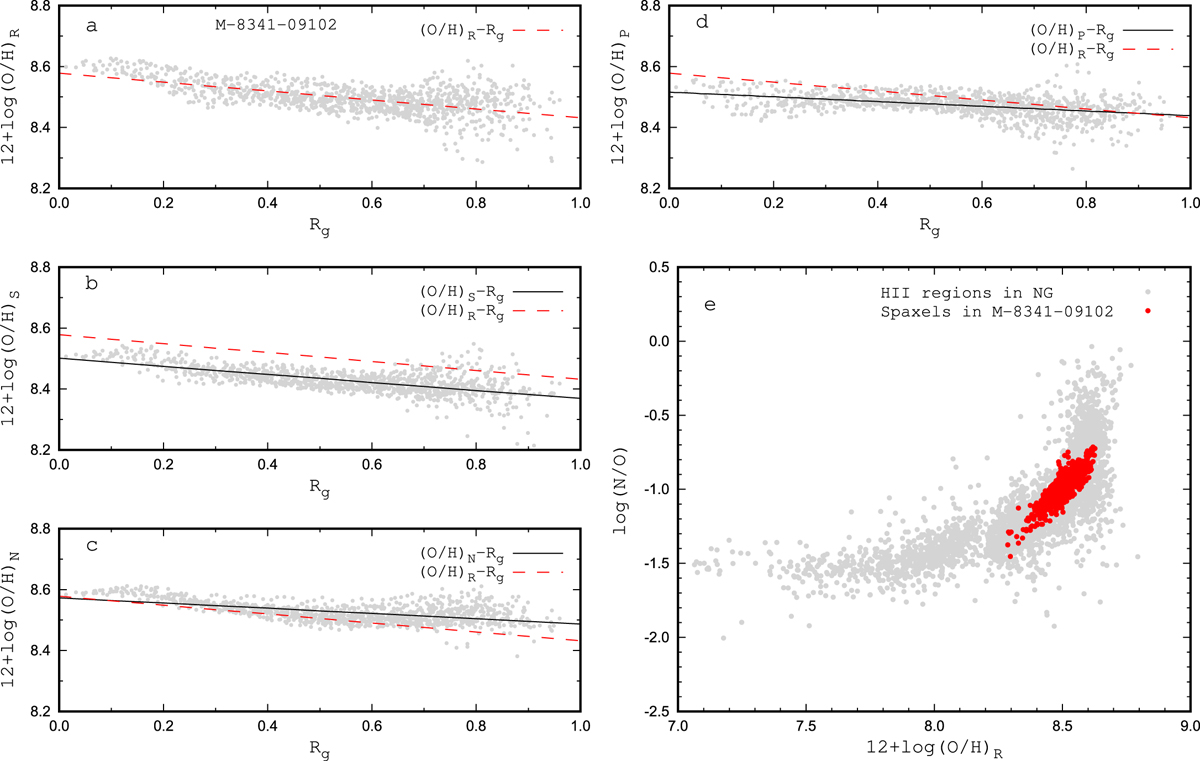
Panels a, b, c, and d: radial distributions of the oxygen abundances determined through the different calibrations in the disc of the MaNGA galaxy M-8341-09102. The grey points are abundances in the individual spaxels. The line is the best fit to those data. The dashed line in each panel is the Rg –(O/H)R relation. Panel e: (O/H)R–N/O diagram. The grey points are abundances in the H II regions in the nearby galaxies; the red points are abundances in the individual spaxels of the MaNGA galaxy M-8341-09102.
Current usage metrics show cumulative count of Article Views (full-text article views including HTML views, PDF and ePub downloads, according to the available data) and Abstracts Views on Vision4Press platform.
Data correspond to usage on the plateform after 2015. The current usage metrics is available 48-96 hours after online publication and is updated daily on week days.
Initial download of the metrics may take a while.