Fig. 8
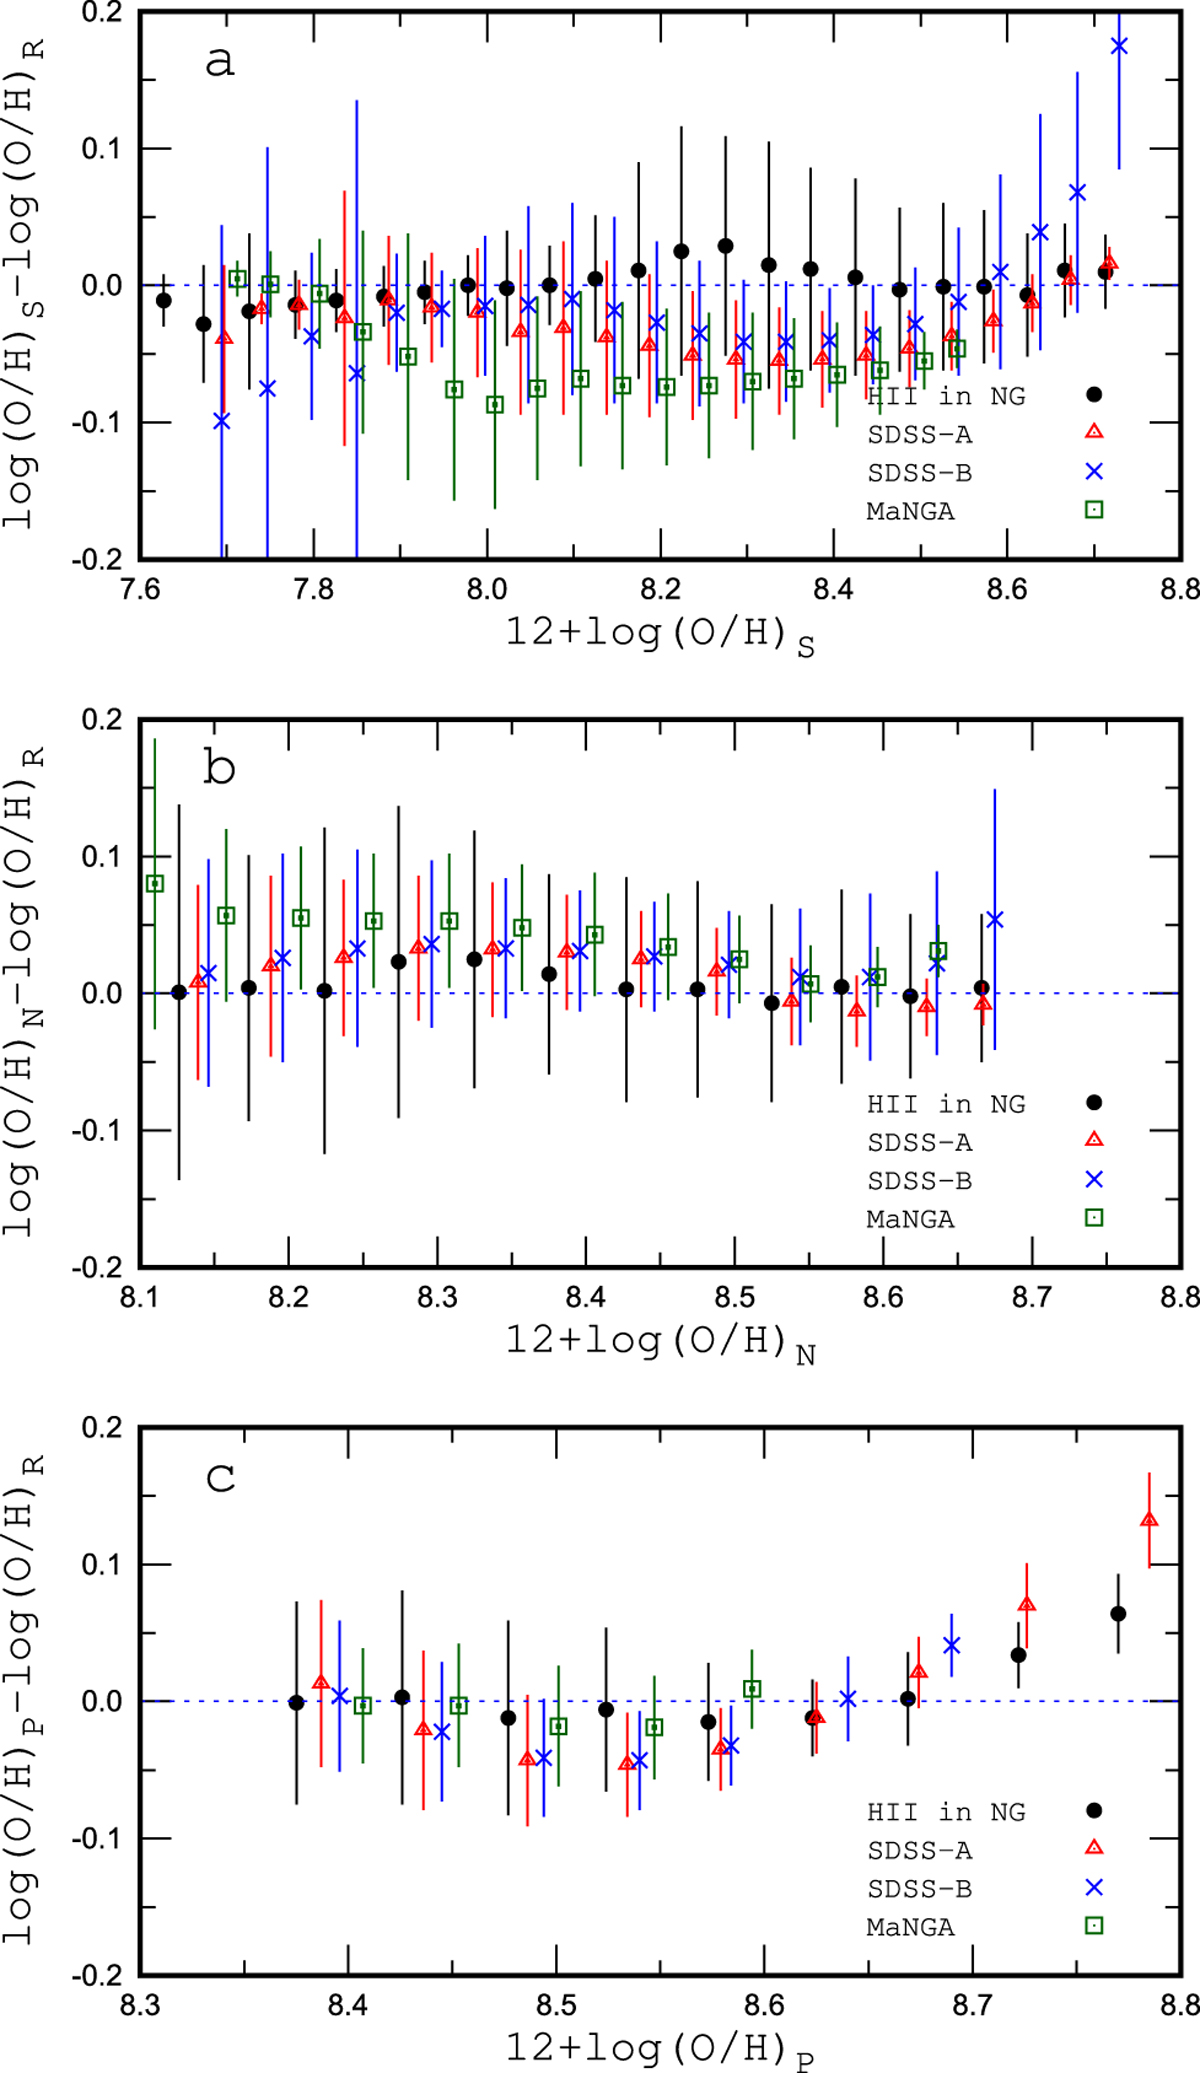
Comparison between oxygen abundances determined through different calibrations based on the slit spectra of H II regions in nearby galaxies, the fibre SDSS spectra (with lines from the SDSS-A and SDSS-B catalogues), and the MaNGA spaxel spectra. The symbols represent the mean values of the differences for objects in bins of 0.05 dex in O/H, and the bars show the scatter of differences in these bins.
Current usage metrics show cumulative count of Article Views (full-text article views including HTML views, PDF and ePub downloads, according to the available data) and Abstracts Views on Vision4Press platform.
Data correspond to usage on the plateform after 2015. The current usage metrics is available 48-96 hours after online publication and is updated daily on week days.
Initial download of the metrics may take a while.