Fig. 7
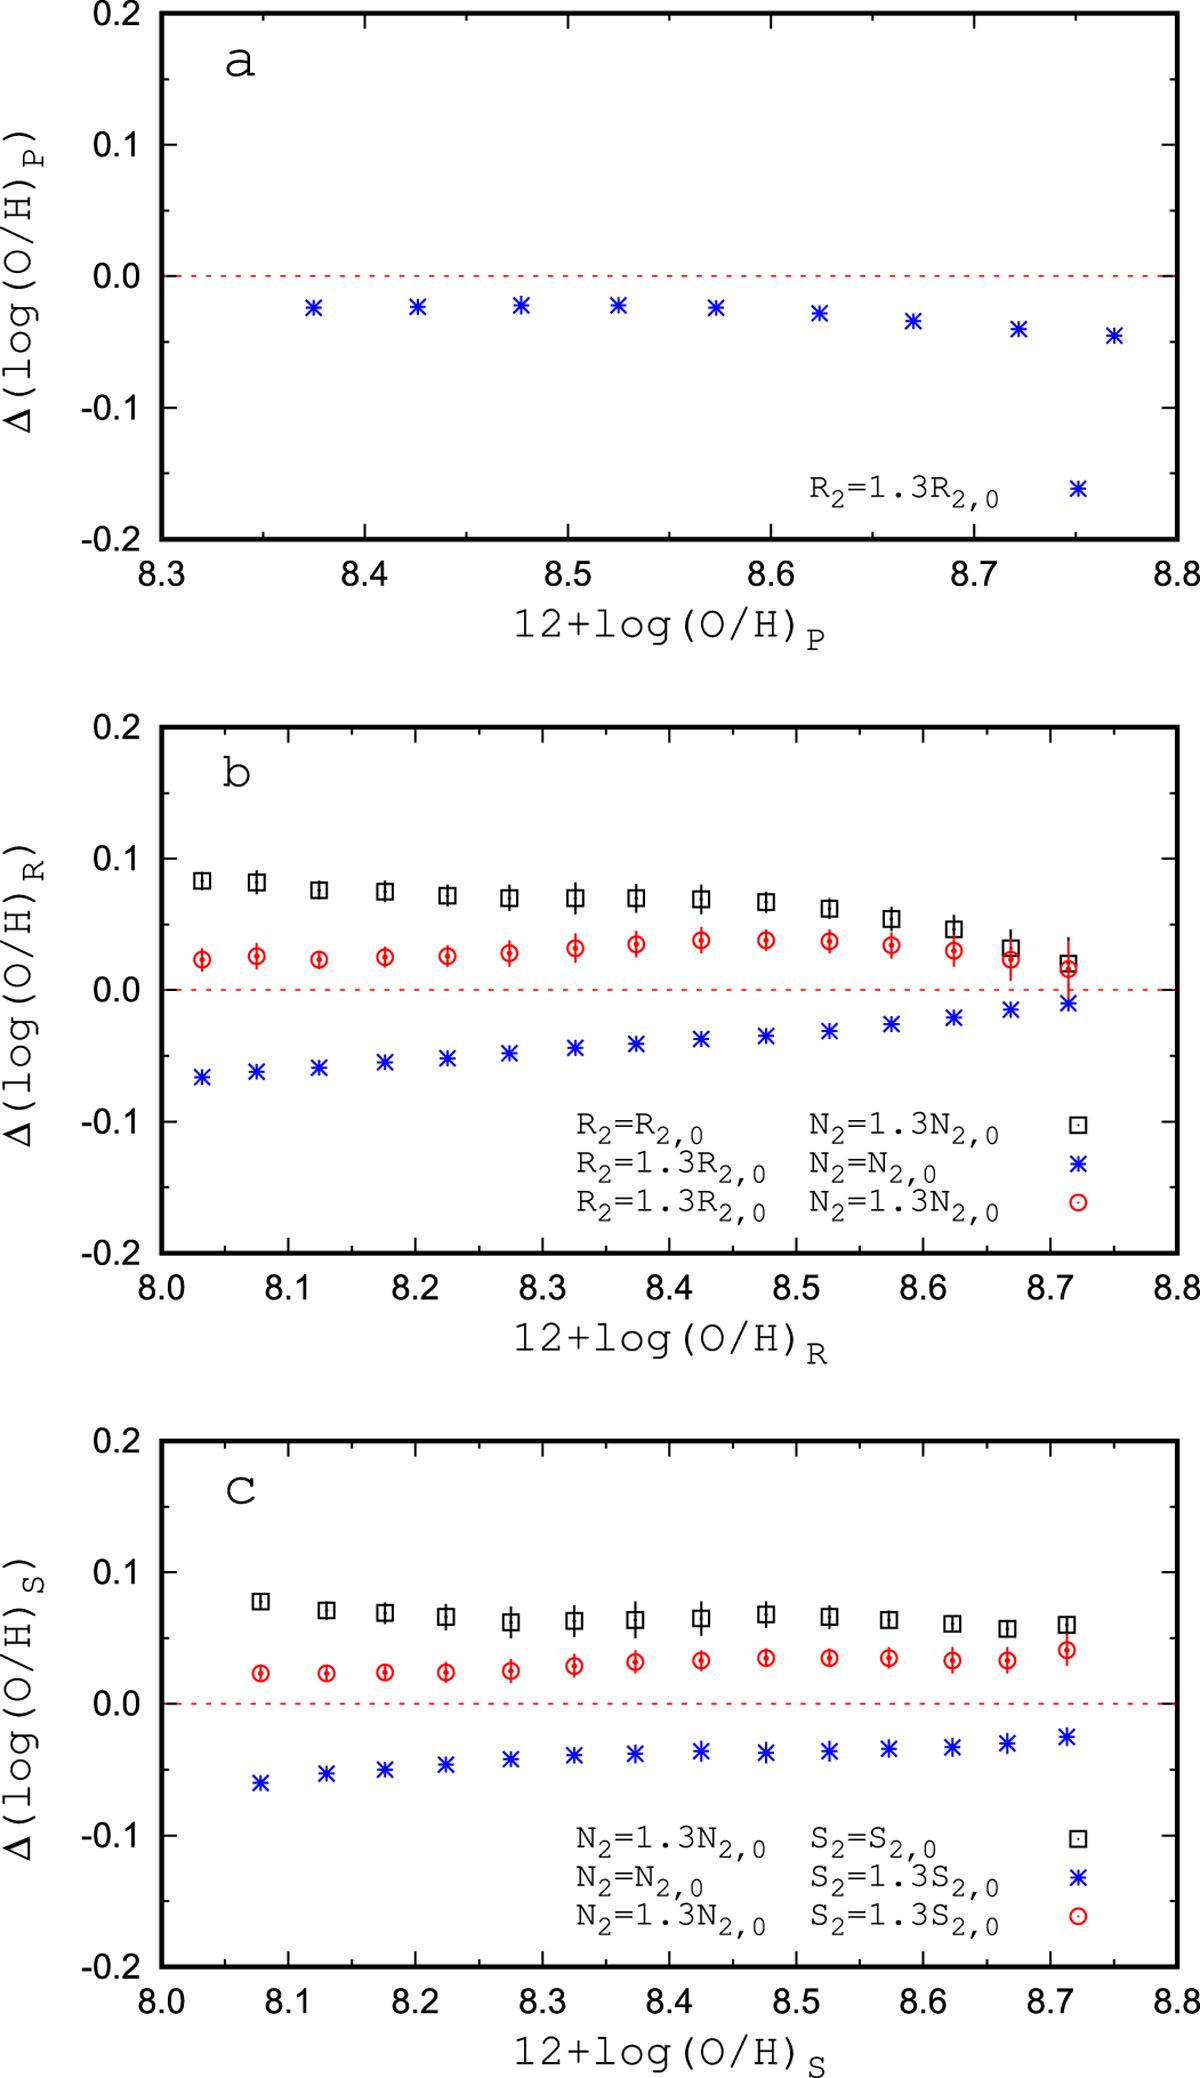
Influence of the increase of the emission-line fluxes on the oxygen abundances obtained through different calibrations. Panel a: difference between oxygen abundances in H II regions in nearby galaxies obtained with the original R2 = R2,0 emission lineand with the emission line R2 = 1.3R2,0 increased by a factor of 1.3. The symbols represent the mean values of the abundance differences for objects in bins of 0.05 dex in (O/H). The bars (comparable with the symbol size) denote the mean values of the scatter of the differences in the bins. Panel b: influence of the increase of the R2 and N2 emission-line fluxes on the oxygen abundances (O/H)R. Panel c: influence of the increase of the N2 and S2 emission-line fluxes on the oxygen abundances (O/H)S.
Current usage metrics show cumulative count of Article Views (full-text article views including HTML views, PDF and ePub downloads, according to the available data) and Abstracts Views on Vision4Press platform.
Data correspond to usage on the plateform after 2015. The current usage metrics is available 48-96 hours after online publication and is updated daily on week days.
Initial download of the metrics may take a while.