Fig. 6
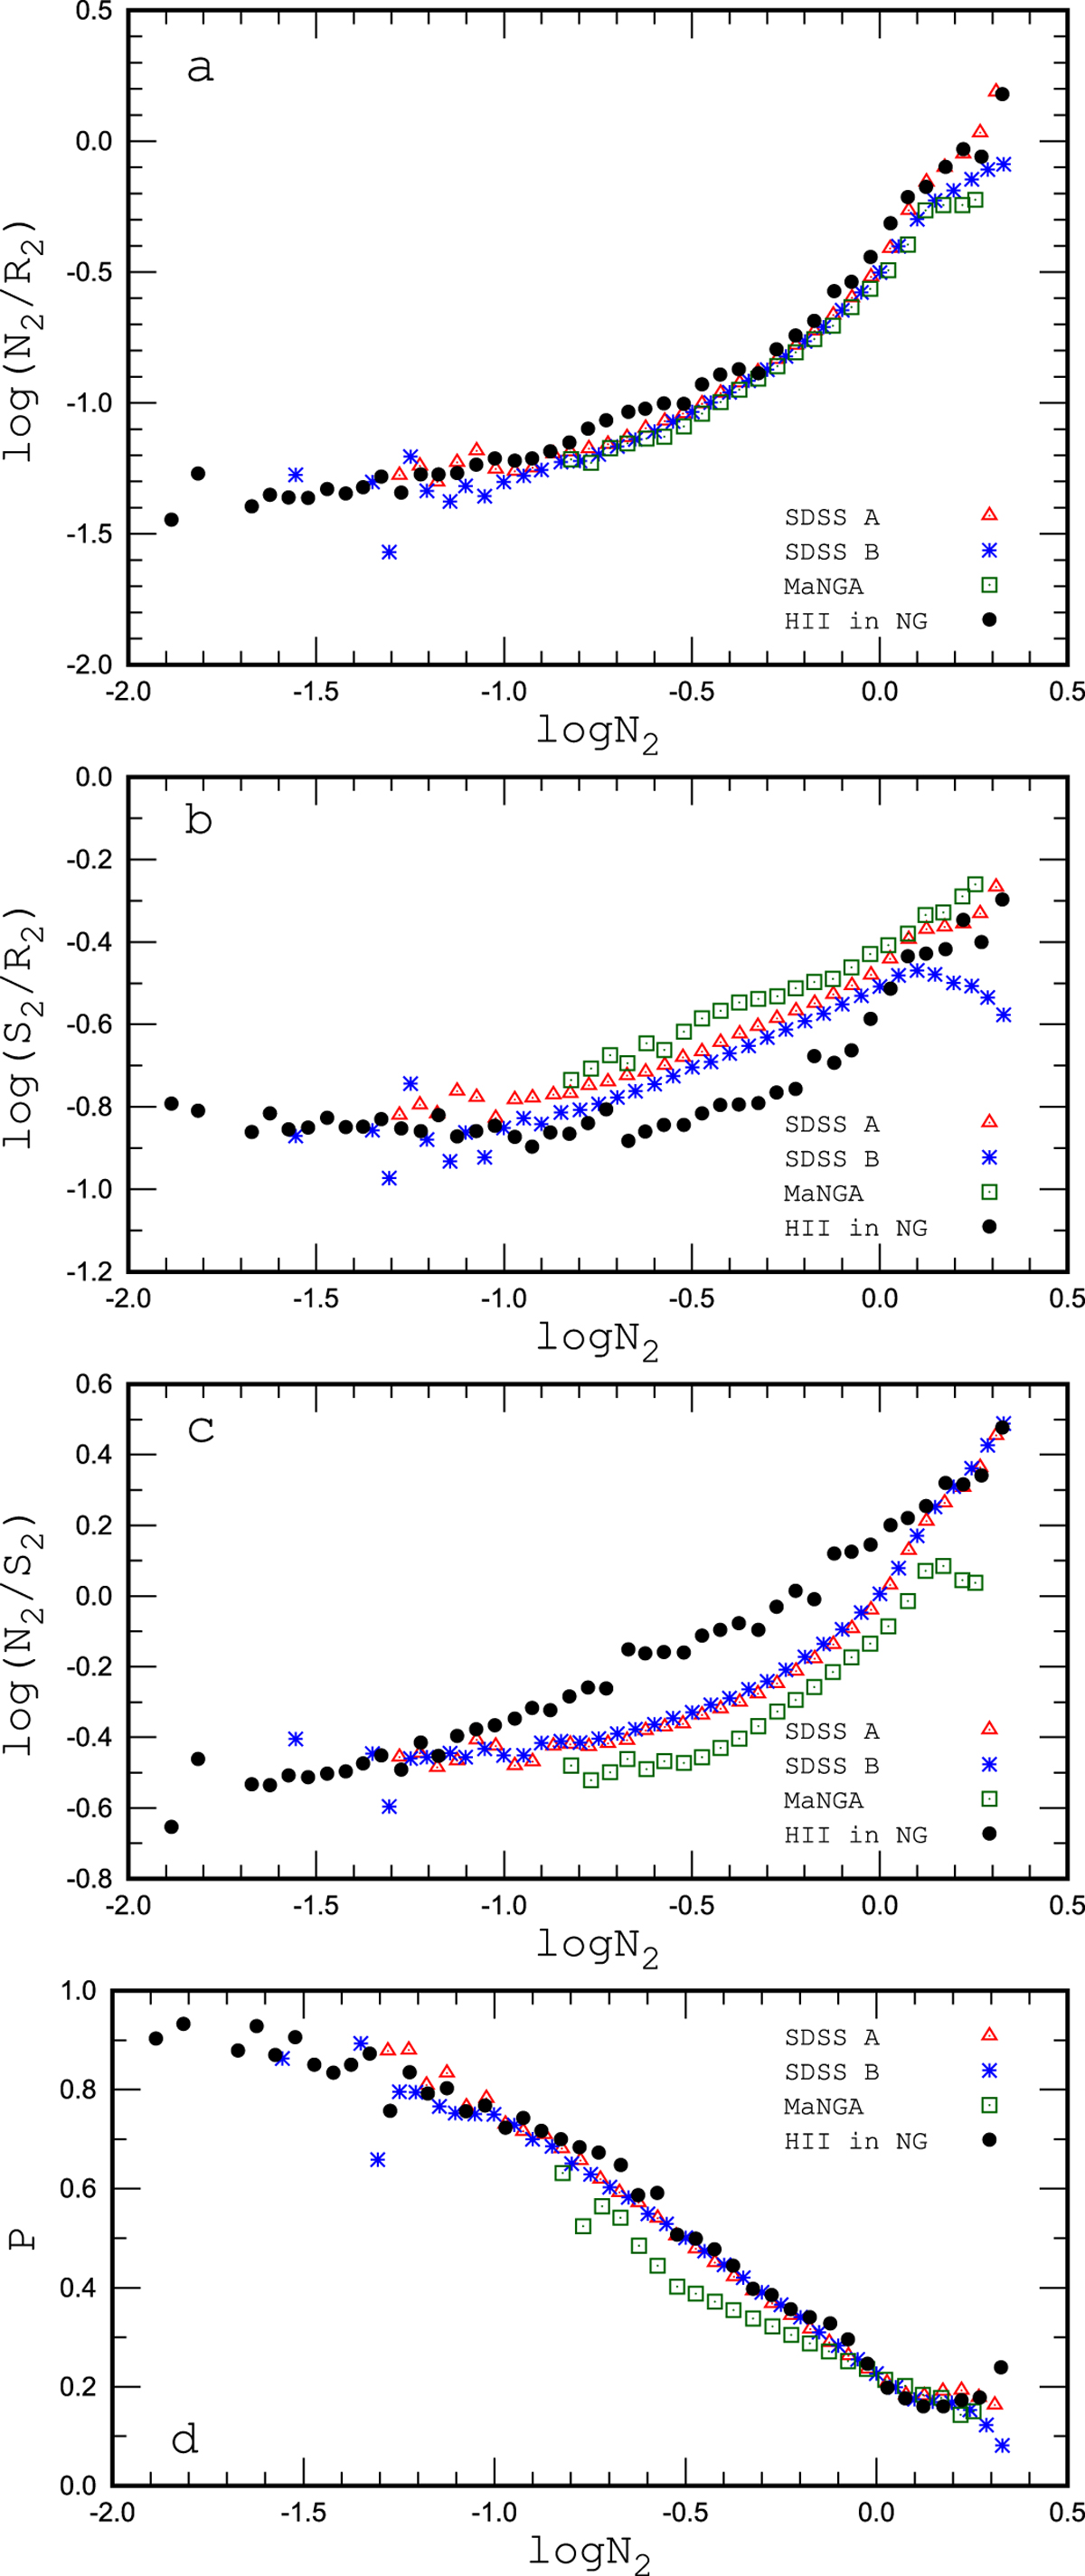
Panel a: nitrogen to oxygen line ratio N2/R2 as a functionof the N2 line intensity for the SDSS fibre spectra (catalogues SDSS-A and SDSS-B), for the spaxel MaNGA spectra, and for the slit spectra of H II regions in nearby galaxies. The symbols represent the mean values for objects in bins of 0.05 dex in logN2. Panels b, c, and d: same but for the sulphur to oxygen line ratio S2/R2, for the nitrogen to sulphur line ratio N2/S2, and for the excitation parameter P, respectively.
Current usage metrics show cumulative count of Article Views (full-text article views including HTML views, PDF and ePub downloads, according to the available data) and Abstracts Views on Vision4Press platform.
Data correspond to usage on the plateform after 2015. The current usage metrics is available 48-96 hours after online publication and is updated daily on week days.
Initial download of the metrics may take a while.