Fig. 4
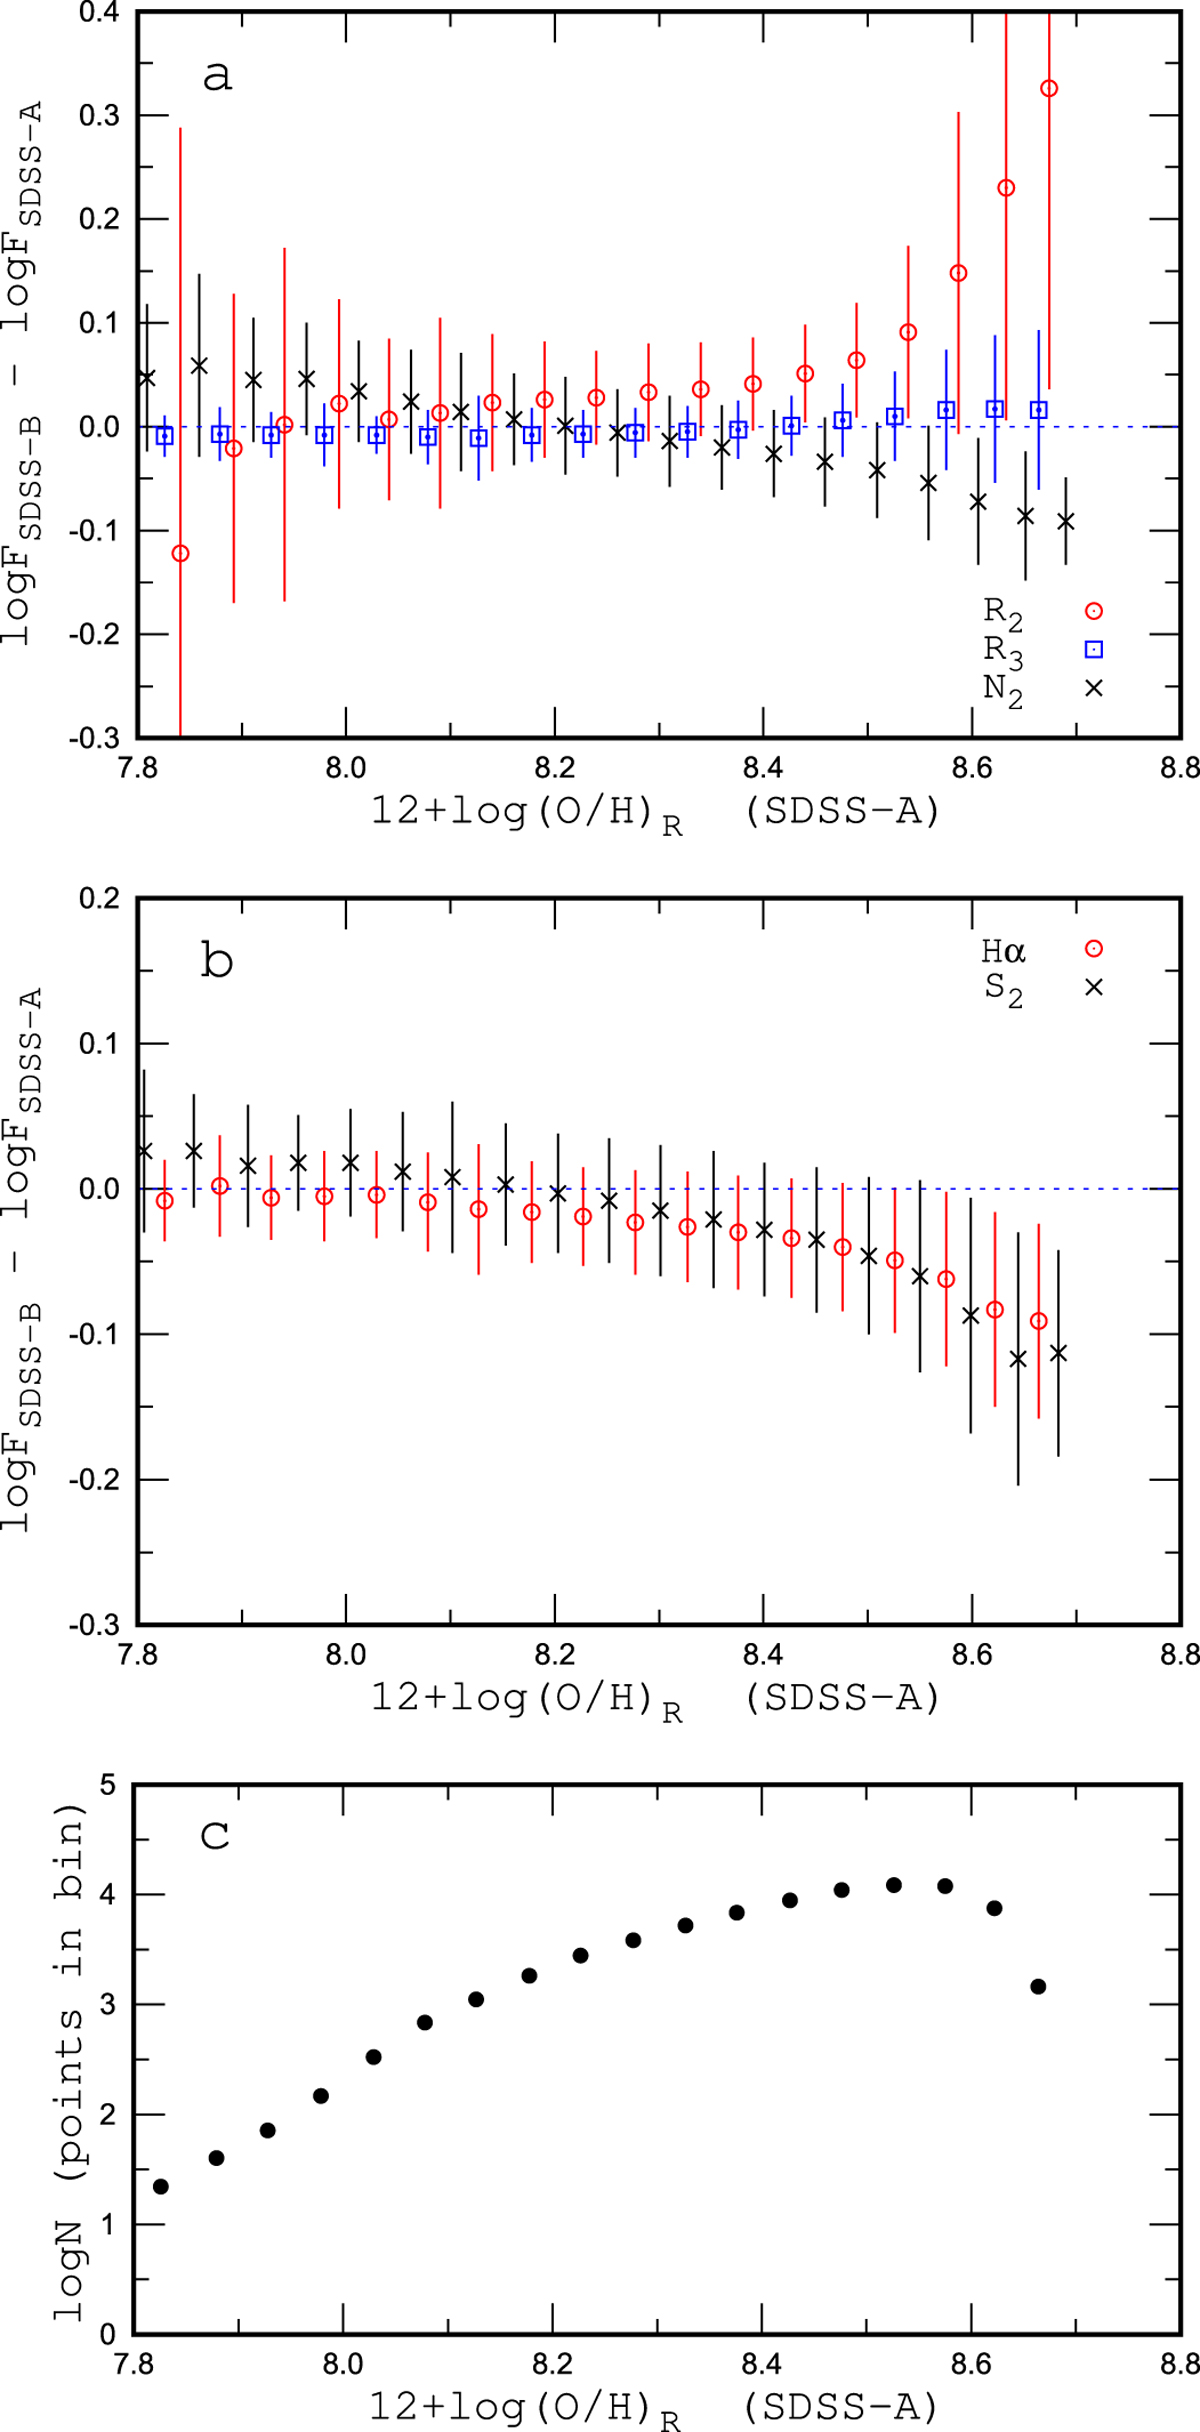
Panels a and b: differences between the measured (non-dereddened) emission-line intensities in the SDSS-A and SDSS-B catalogues.The symbols represent the mean values of the differences for objects in bins of 0.05 dex in (O/H)R,SDSS−A. The bars denote the mean values of the scatter of the differences for objects in bins. Panel c: number of points (objects) in the bin.
Current usage metrics show cumulative count of Article Views (full-text article views including HTML views, PDF and ePub downloads, according to the available data) and Abstracts Views on Vision4Press platform.
Data correspond to usage on the plateform after 2015. The current usage metrics is available 48-96 hours after online publication and is updated daily on week days.
Initial download of the metrics may take a while.