Fig. 15
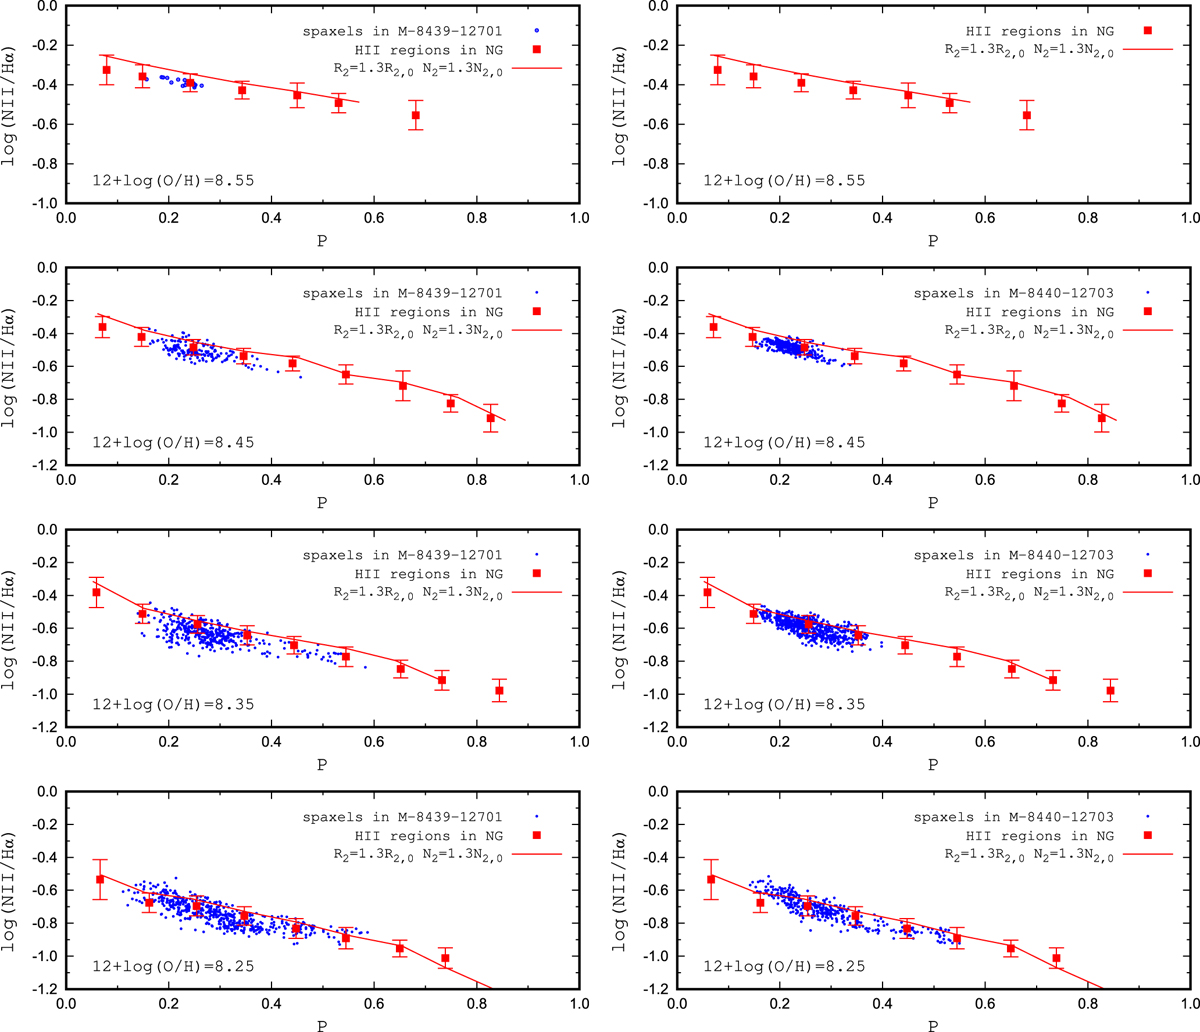
Left column panels: [N II]/Hα as a functionof excitation parameter P for the spaxels in the MaNGA galaxy M-8439-12701 and for the H II regions in nearby galaxies. The blue points are spaxels with abundances 12 + log(O/H) ± 0.05 in M-8439-12701 (the value of 12 + log(O/H) is indicated in each panel). The red squares are the H II regions in nearby galaxies with abundances in the same interval. The squares represent the mean values of the [N II]/Hα in bins of 0.05 dex in P. The bars denote the mean values of the scatter of the [N II]/Hα in the bins. The solid line is for the same H II regions but both the R2 and N2 lines are increased by a factor of 1.3. Right column panels: same for theMaNGA galaxy M-8440-12703.
Current usage metrics show cumulative count of Article Views (full-text article views including HTML views, PDF and ePub downloads, according to the available data) and Abstracts Views on Vision4Press platform.
Data correspond to usage on the plateform after 2015. The current usage metrics is available 48-96 hours after online publication and is updated daily on week days.
Initial download of the metrics may take a while.