Fig. 12
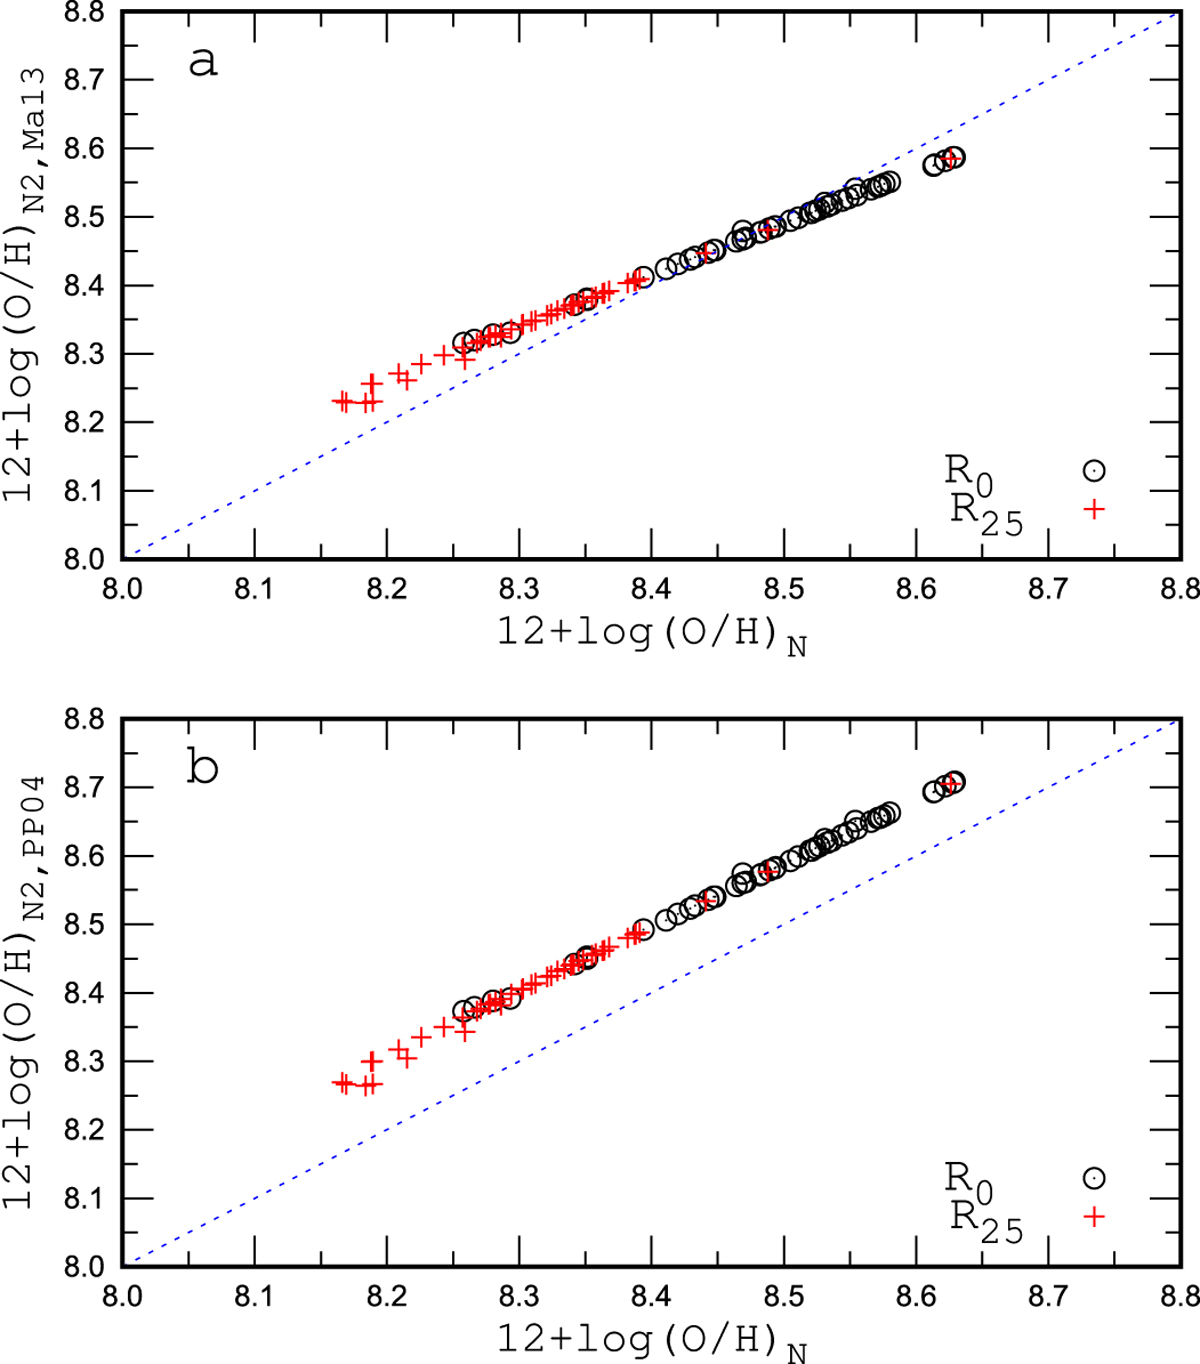
Comparison of the oxygen abundances estimated through different N2 calibration relations. Panel a: (O/H)![]() abundances obtained through the N2 calibration relation of Marino et al. (2013) versus the (O/H)N abundances determined using our expression for the N calibration. The circles indicate the central (intersect) oxygen abundances for our sample of MaNGA galaxies. The plus symbols show abundances (intersect values) at the optical radius R25. The line is that of equal values. Panel b: same as the upper panel but for the (O/H)
abundances obtained through the N2 calibration relation of Marino et al. (2013) versus the (O/H)N abundances determined using our expression for the N calibration. The circles indicate the central (intersect) oxygen abundances for our sample of MaNGA galaxies. The plus symbols show abundances (intersect values) at the optical radius R25. The line is that of equal values. Panel b: same as the upper panel but for the (O/H)![]() abundances obtained through the N2 calibration relation of Pettini & Pagel (2004).
abundances obtained through the N2 calibration relation of Pettini & Pagel (2004).
Current usage metrics show cumulative count of Article Views (full-text article views including HTML views, PDF and ePub downloads, according to the available data) and Abstracts Views on Vision4Press platform.
Data correspond to usage on the plateform after 2015. The current usage metrics is available 48-96 hours after online publication and is updated daily on week days.
Initial download of the metrics may take a while.