Fig. 11
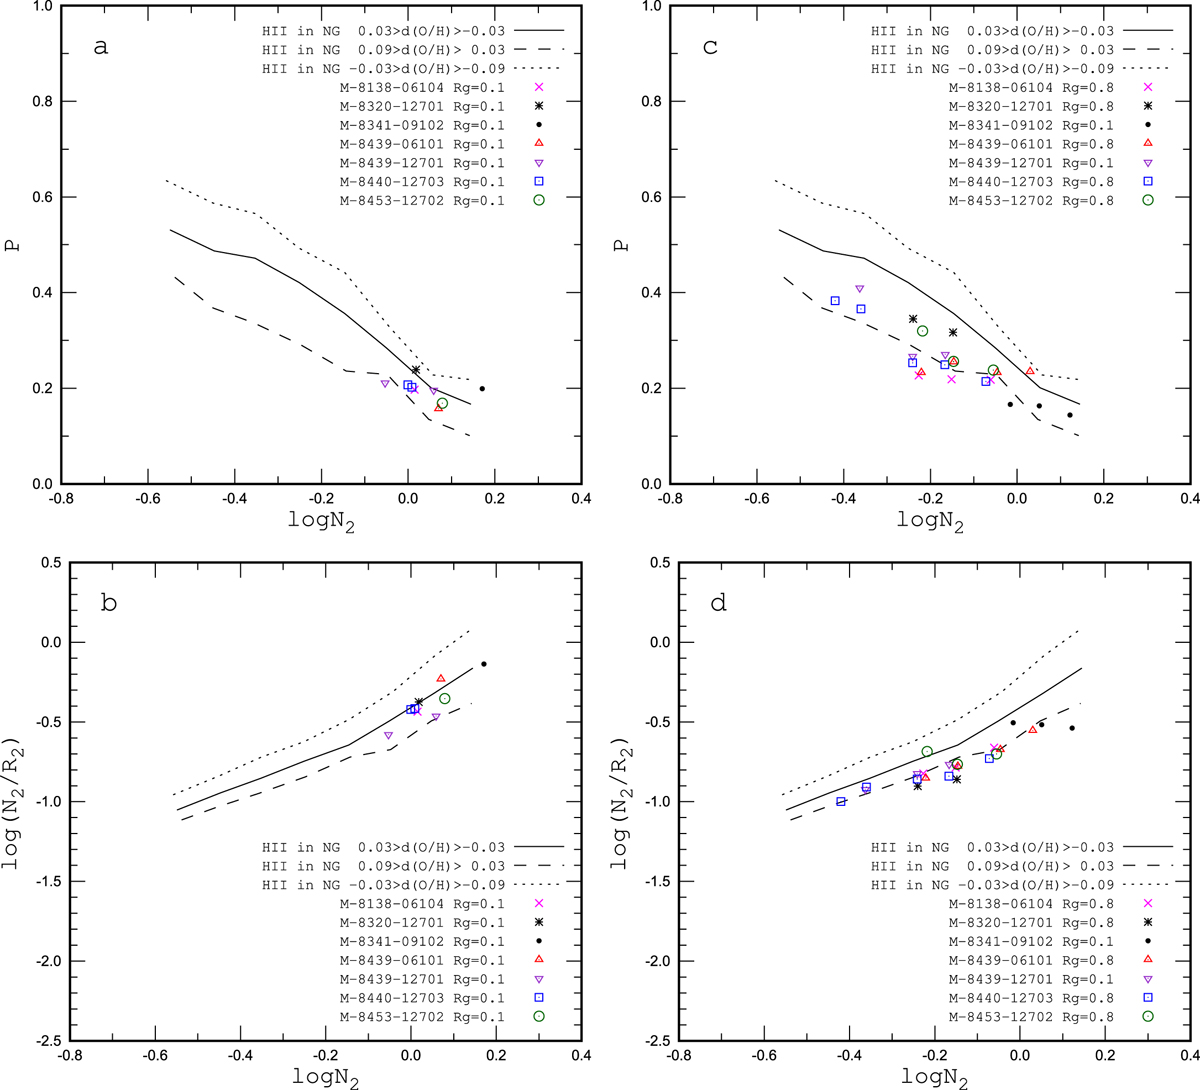
Panel a: symbols show the excitation parameter P as a functionof the N2 line intensityfor the spaxels in central regions (Rg < 0.1) of several MaNGA galaxies. The mean values of P for objects in bins of 0.1 dex in logN2 are presented. The solid line shows the excitation parameter P as a functionof N2 for the H II regions in the nearby galaxies with 0.03 > log(O/H)N – log(O/H)R > −0.03. The long-dashed line shows P for H II regions with 0.09 > log(O/H)N – log(O/H)R > 0.03, and the short-dashed line shows P for H II regions with − 0.03 > log(O/H)N – log(O/H)R > −0.09. Panel b: same as panel a but for the N2/R2 line ratio. Panel c shows the same as panel a but for spaxels with galactocentric distances from 0.775 to 0.825 Rg. Panel d shows the same as panel b but for spaxels with galactocentric distances from 0.775 to 0.825 Rg.
Current usage metrics show cumulative count of Article Views (full-text article views including HTML views, PDF and ePub downloads, according to the available data) and Abstracts Views on Vision4Press platform.
Data correspond to usage on the plateform after 2015. The current usage metrics is available 48-96 hours after online publication and is updated daily on week days.
Initial download of the metrics may take a while.