Fig. 10
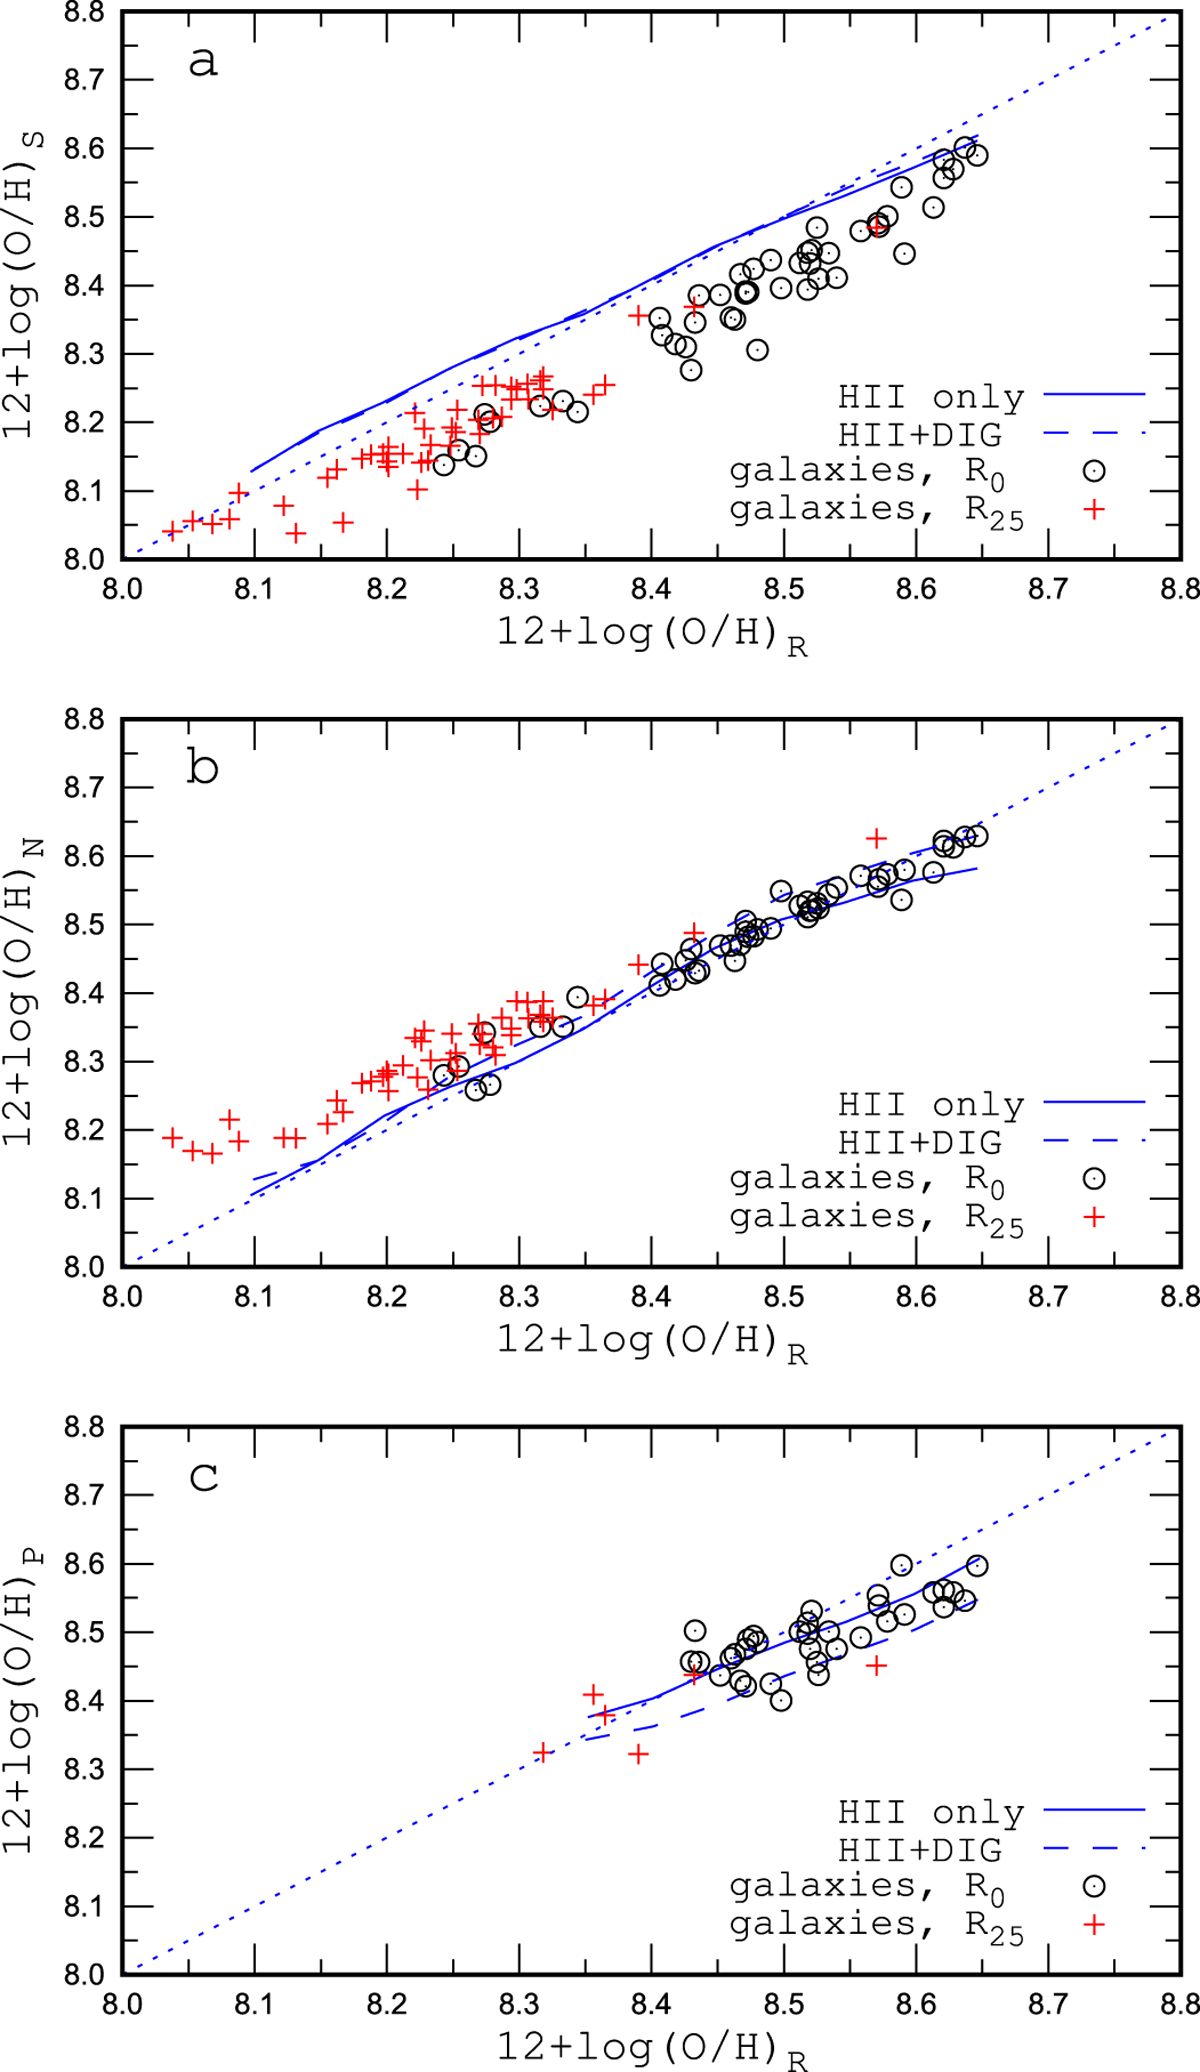
Comparison of the (O/H)R oxygen abundances with abundances estimated through other calibrations for our sample of MaNGA galaxies. The circles in each panel show the central (intersect) oxygen abundances. The plus symbols indicate abundances (intersect values) at the optical radius R25. The solidline shows the oxygen abundances for the sample of H II regions in the nearby galaxies. The long-dashed line shows the oxygen abundances for those H II regions obtained with the lines R2, N2, and S2 increased bya factor of 1.3 to simulate the DIG contribution to the spectra. The short-dashed line indicates unity.
Current usage metrics show cumulative count of Article Views (full-text article views including HTML views, PDF and ePub downloads, according to the available data) and Abstracts Views on Vision4Press platform.
Data correspond to usage on the plateform after 2015. The current usage metrics is available 48-96 hours after online publication and is updated daily on week days.
Initial download of the metrics may take a while.