Fig. 2
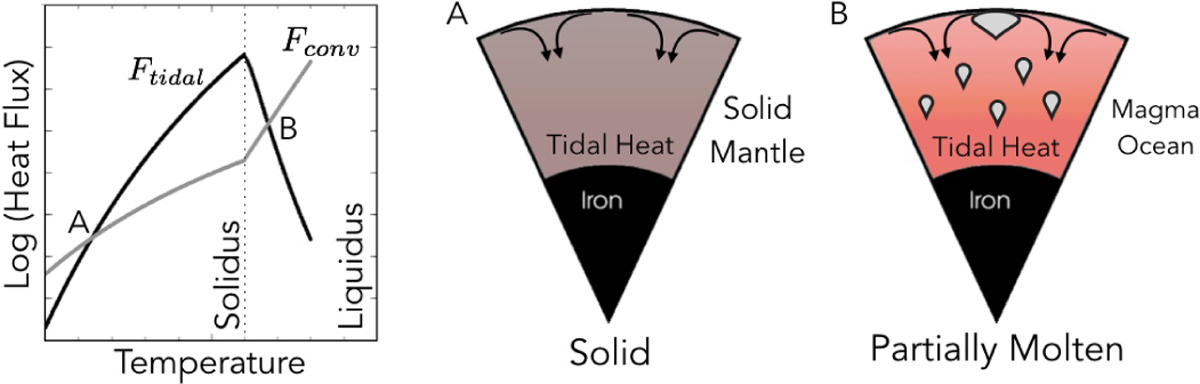
Left: schematic representation of the heat flux (in log units) from tidal heating (black line) and convective heat transport (gray) as a function of temperature. Two equilibria are possible: point (A) represents a balance between tidal heating and convection in a purely solid mantle (Teq is less than the solidus temperature Ts). This stateis depicted schematically in the middle panel. Point (B) represents an equilibrium for which Teq > Ts, implying a partially molten rock mantle exists within the planet. This state is shown schematically in the right panel.
Current usage metrics show cumulative count of Article Views (full-text article views including HTML views, PDF and ePub downloads, according to the available data) and Abstracts Views on Vision4Press platform.
Data correspond to usage on the plateform after 2015. The current usage metrics is available 48-96 hours after online publication and is updated daily on week days.
Initial download of the metrics may take a while.