Fig. 7
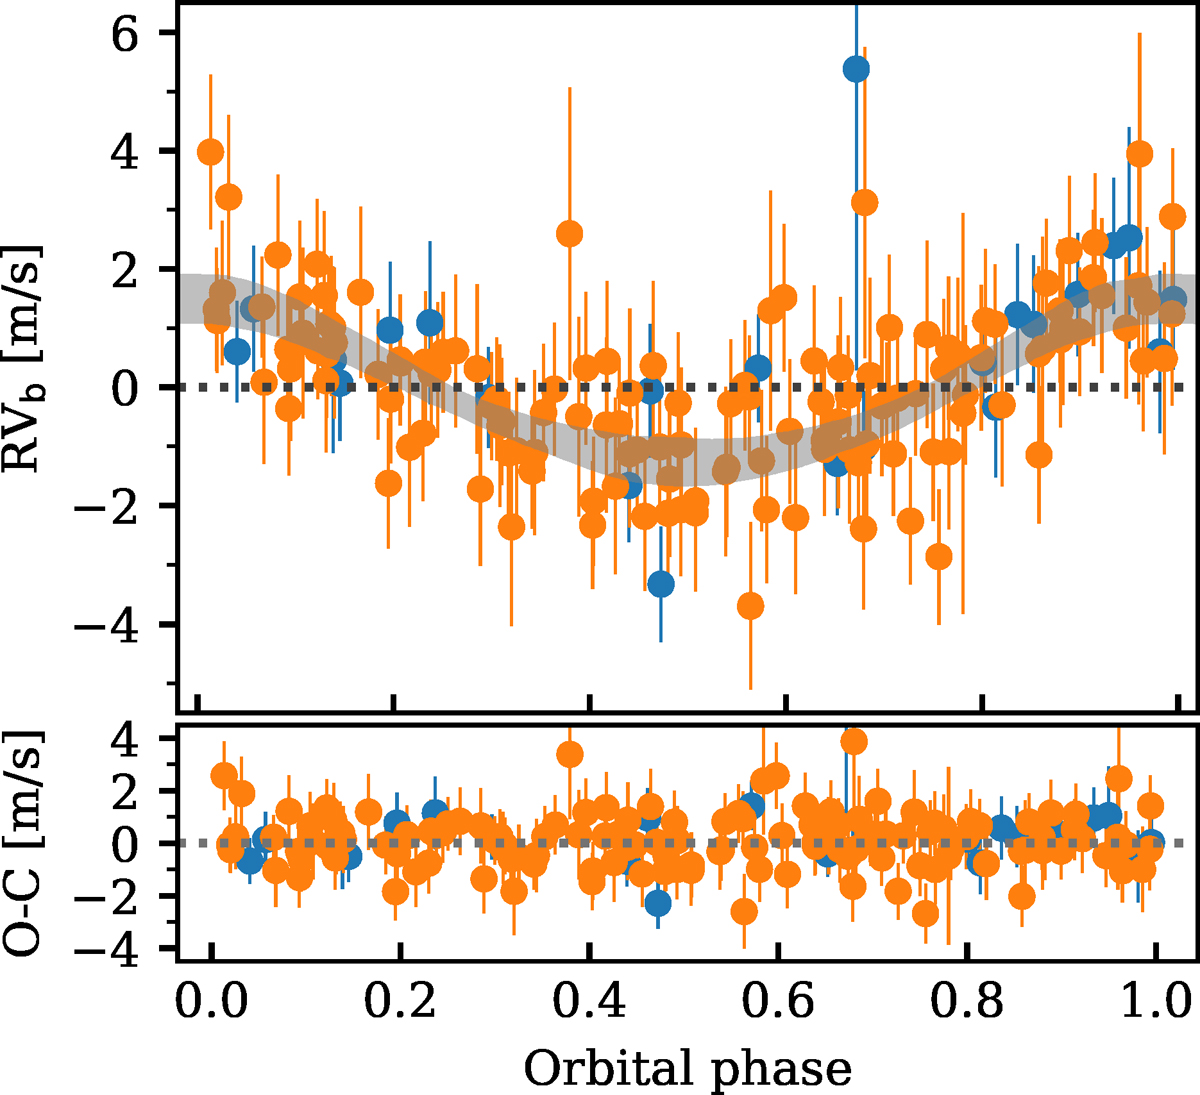
Radial velocity induced by the planet on its host star, phase-folded to the maximum-a posteriori (MAP) orbital period. The effect of the secular acceleration and the Gaussian process prediction were subtracted from the data (using the MAP parameter values). The orange and blue points correspond to the pre- and post-upgrade velocities, respectively. The inferred MAP additional white noise term (σJ and ![]() ) were added in quadrature to the velocity uncertainties. The grey shaded region extends between the 5th and 95th percentile ofthe model at each orbital phase, computed over 10 000 samples of the merged posterior distribution.
) were added in quadrature to the velocity uncertainties. The grey shaded region extends between the 5th and 95th percentile ofthe model at each orbital phase, computed over 10 000 samples of the merged posterior distribution.
Current usage metrics show cumulative count of Article Views (full-text article views including HTML views, PDF and ePub downloads, according to the available data) and Abstracts Views on Vision4Press platform.
Data correspond to usage on the plateform after 2015. The current usage metrics is available 48-96 hours after online publication and is updated daily on week days.
Initial download of the metrics may take a while.