Fig. 3
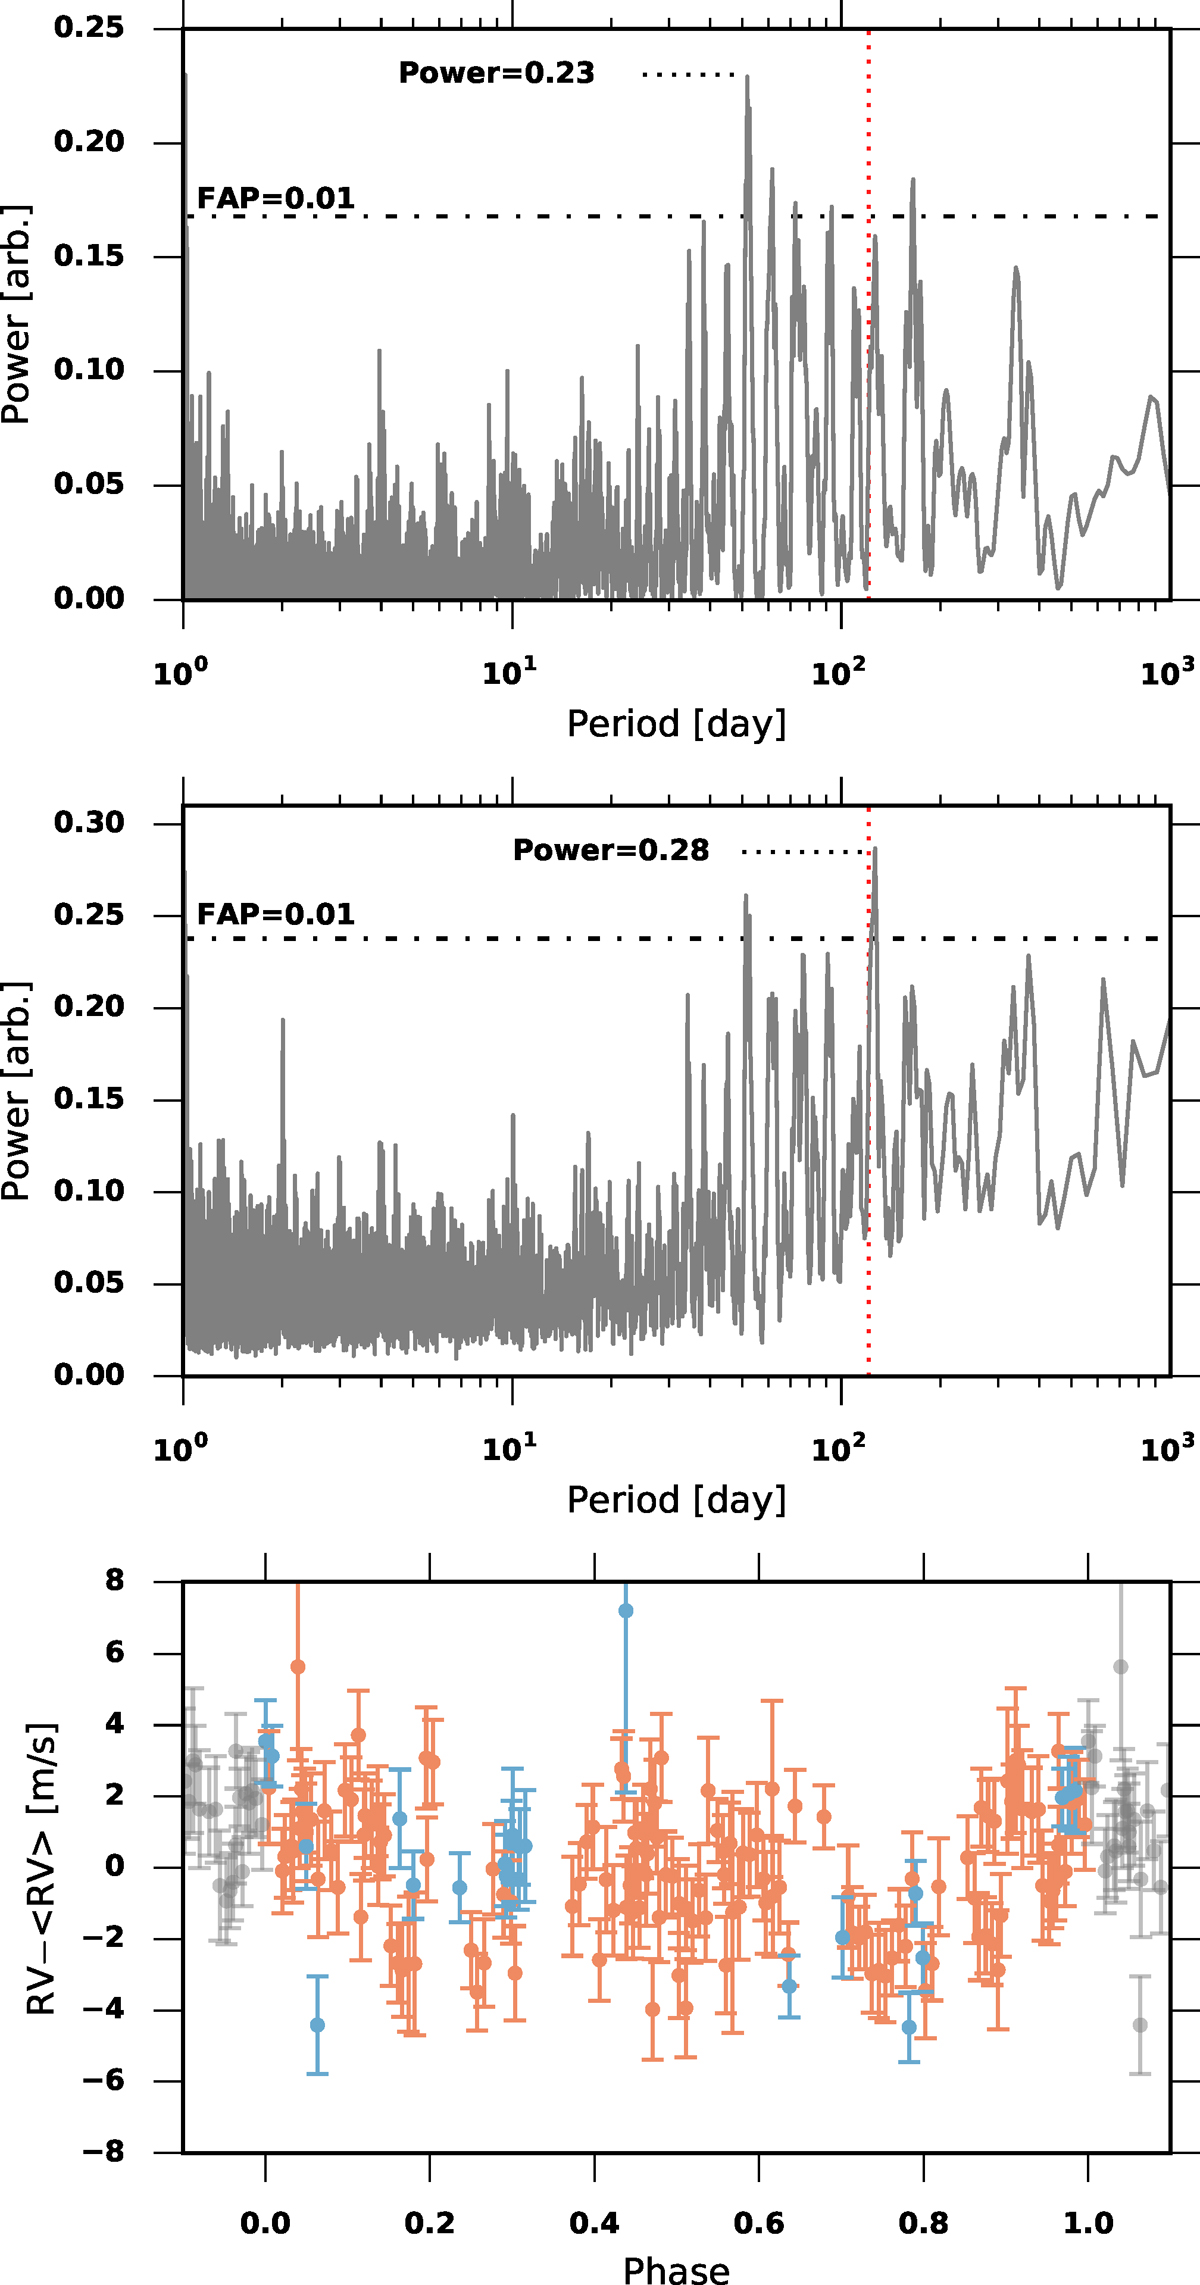
Radial velocity residuals after subtraction of the best-fit Keplerian and drift. Top: GLS periodogram is shown. Middle: KGLS periodogram is shown. Bottom: residuals phase-folded to a P = 123 days period are shown. The vertical red dashed line indicates the 121 day rotation period inferred from the ASAS photometry. The red and blue points represent pre- and post-upgrade measurements, respectively.
Current usage metrics show cumulative count of Article Views (full-text article views including HTML views, PDF and ePub downloads, according to the available data) and Abstracts Views on Vision4Press platform.
Data correspond to usage on the plateform after 2015. The current usage metrics is available 48-96 hours after online publication and is updated daily on week days.
Initial download of the metrics may take a while.