Fig. 1
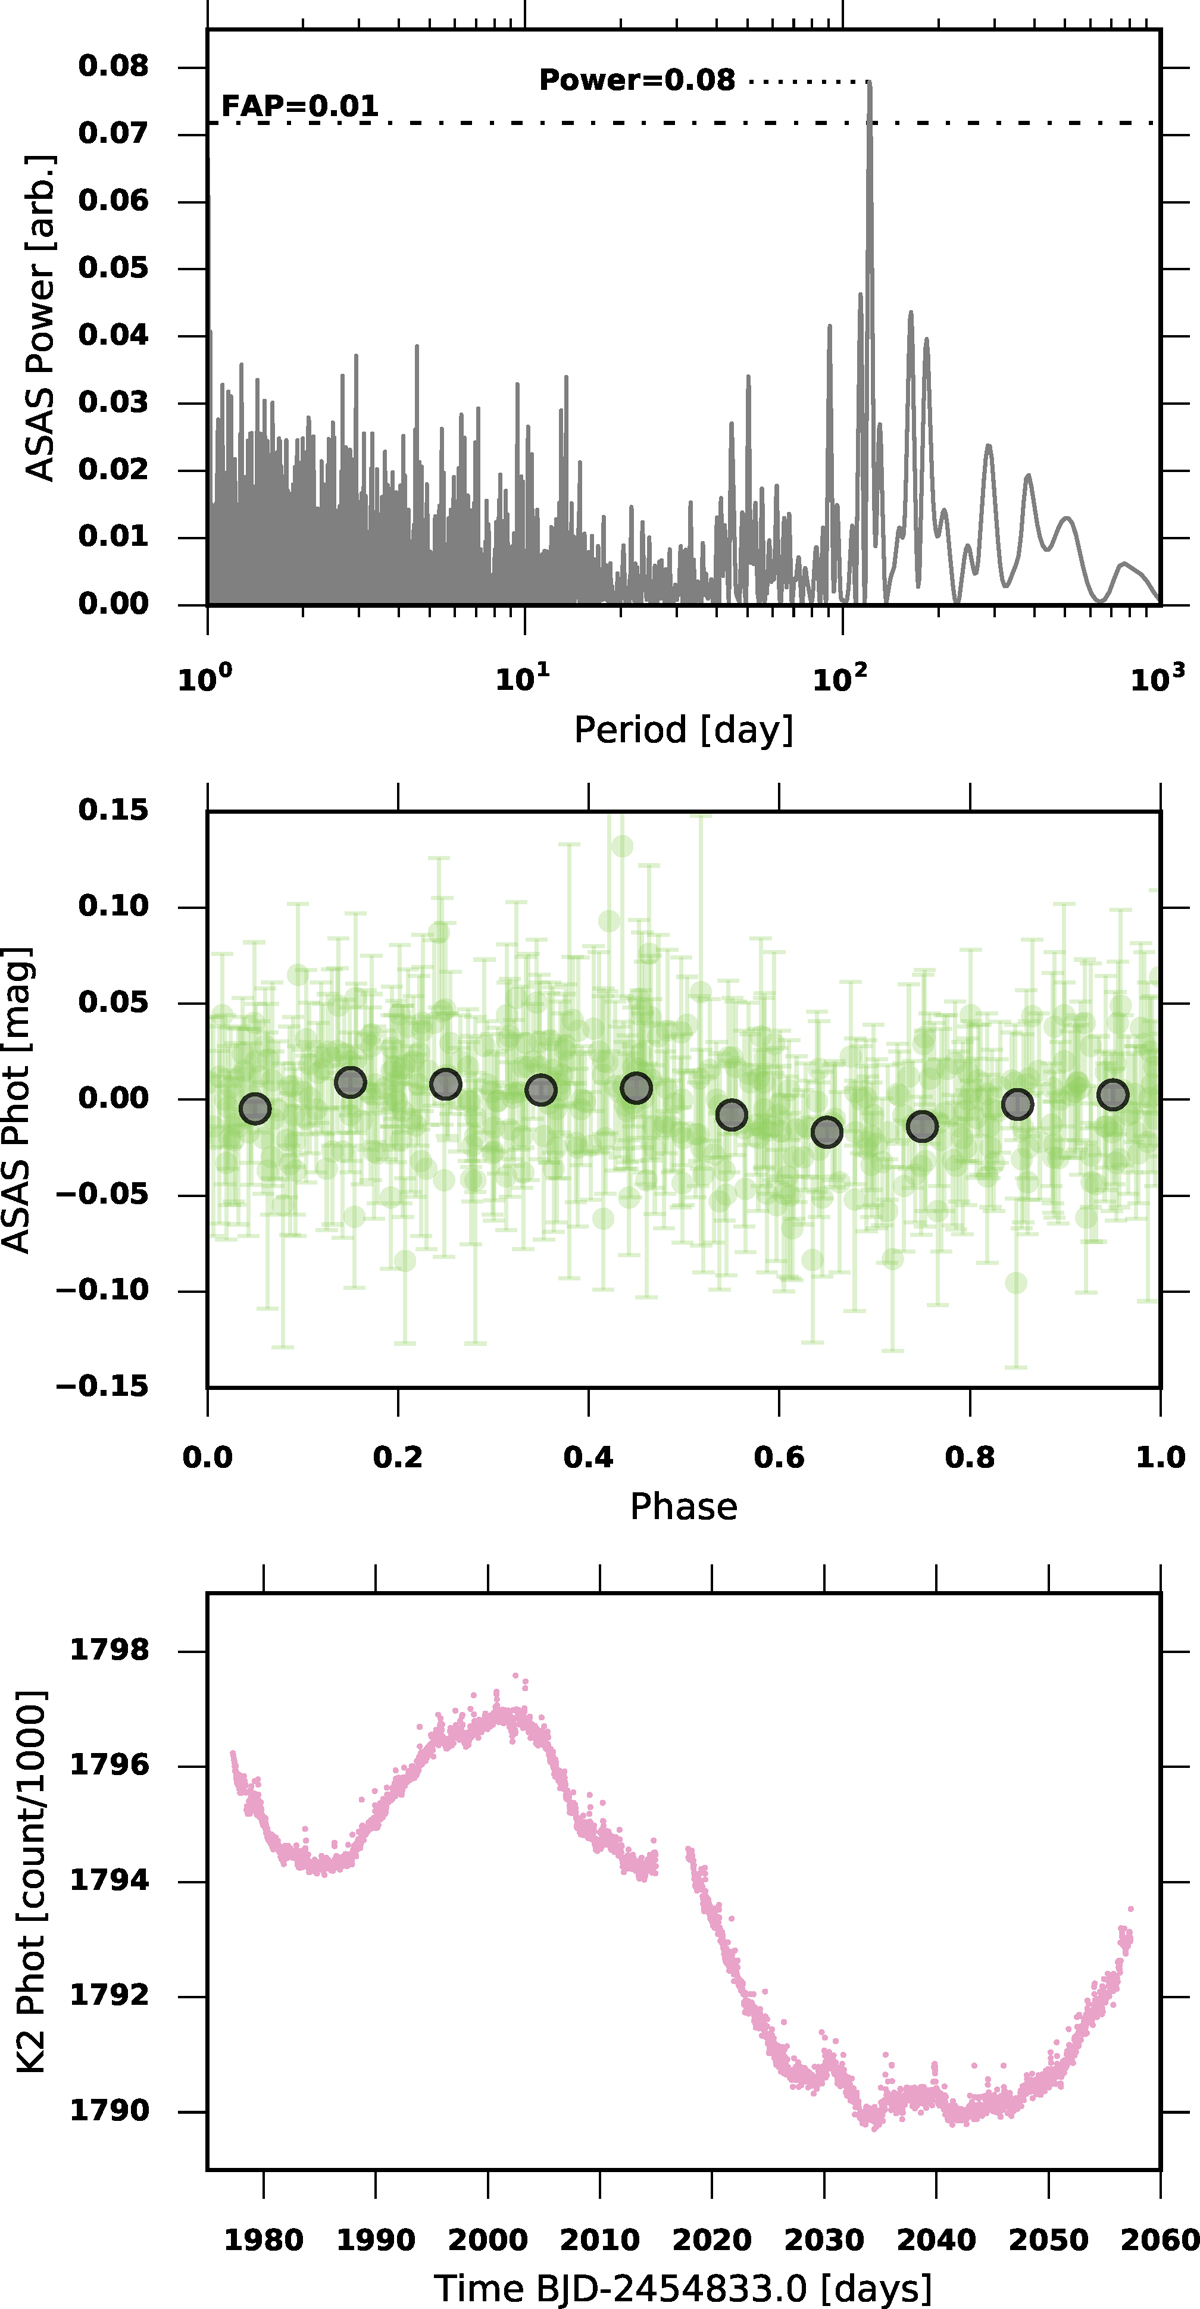
Photometry of Ross 128. Top: periodogram of the ASAS V -band photometry. Middle: ASAS photometry phase-folded to P = 121.2 days. Grey filled circles are median values in 0.1-phase bins. Bottom: K2 photometry extracted with the Everest pipeline (Luger et al. 2016) as a function of time. We only show corrected photometry FCOR with the highest quality flag.
Current usage metrics show cumulative count of Article Views (full-text article views including HTML views, PDF and ePub downloads, according to the available data) and Abstracts Views on Vision4Press platform.
Data correspond to usage on the plateform after 2015. The current usage metrics is available 48-96 hours after online publication and is updated daily on week days.
Initial download of the metrics may take a while.