Fig. A.1
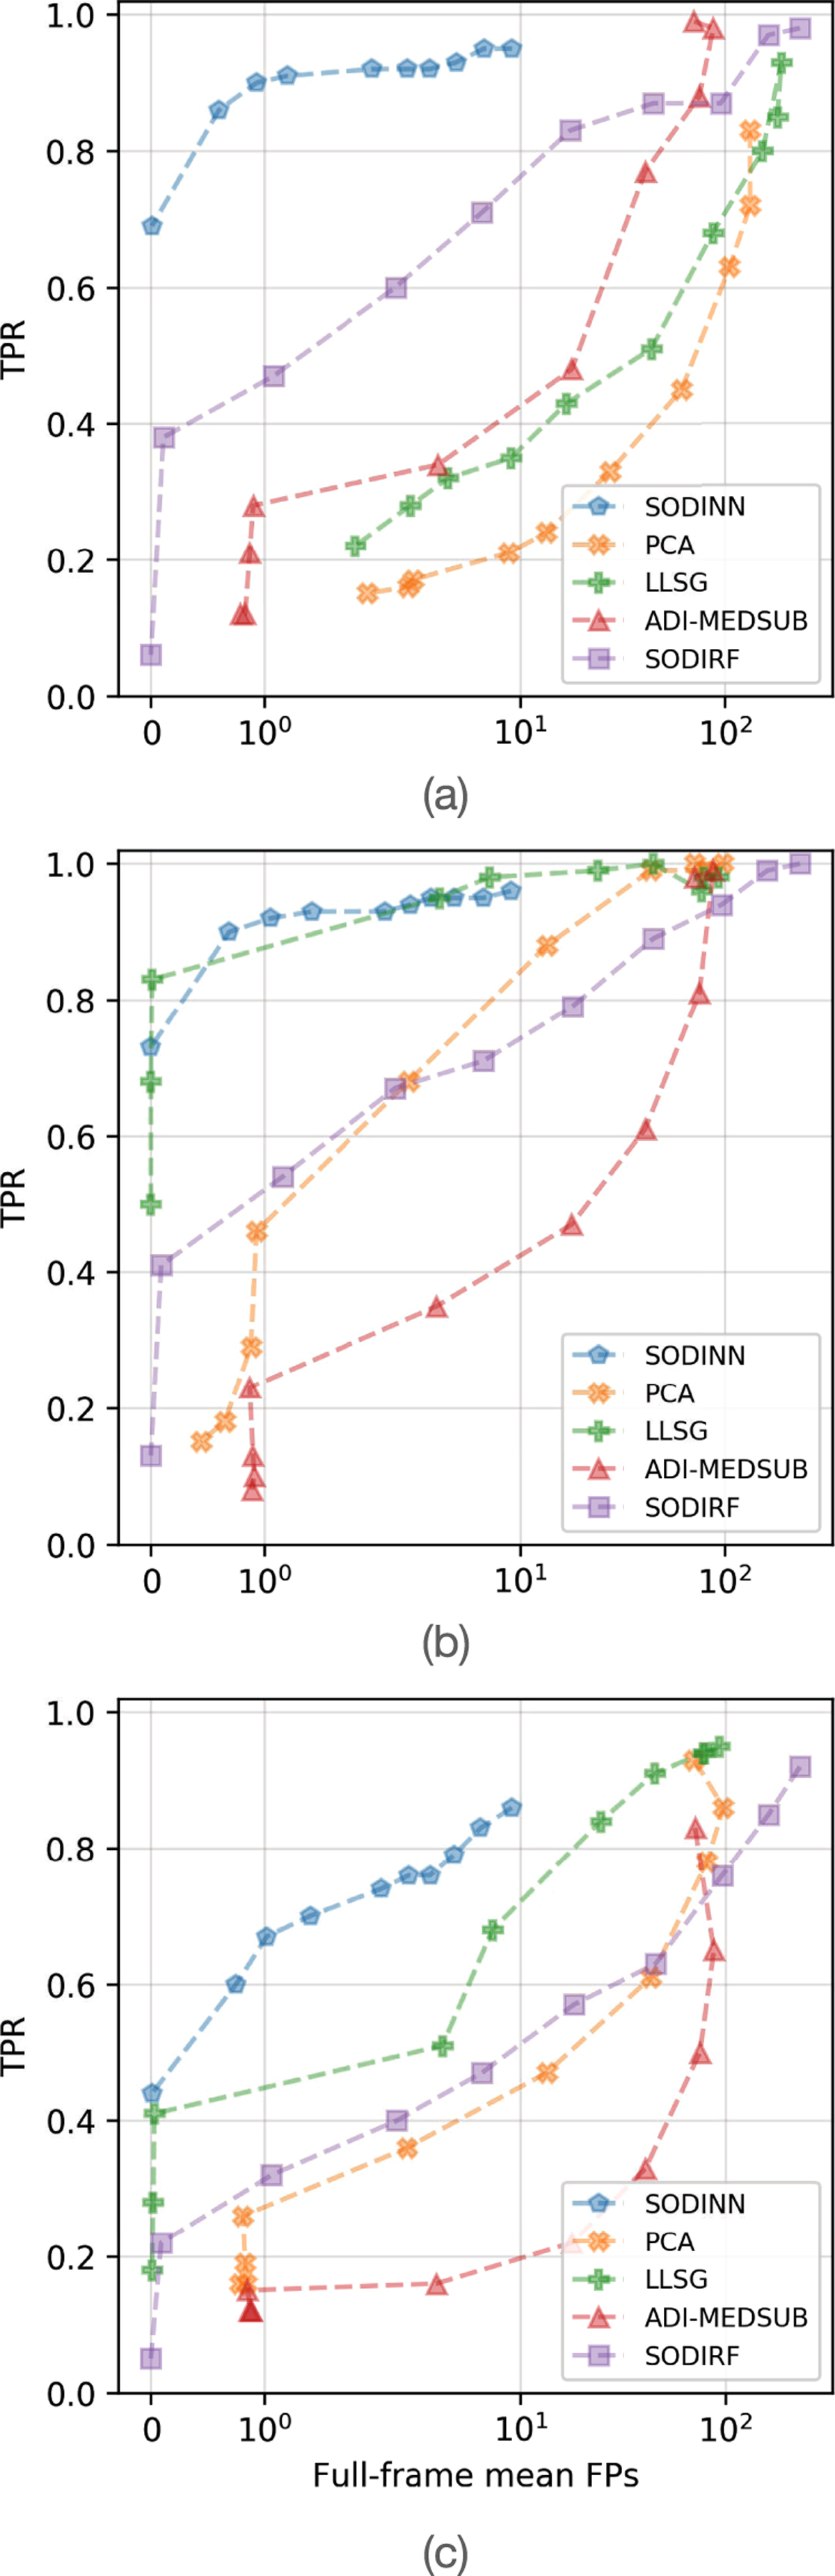
Exemplification of the pitfalls of comparative studies using ROC curves, and how easy it is to obtain incorrect relative performances and present inaccurate conclusions. These ROC curves are built for the same dataset and separation from the star. Panels a and b: ROC curves when changing the algorithms hyper-parameters: the number of PCs for ADI-PCA and the rank of LLSG. In panel a a more aggressive value is used with respect to panel b. The performance of ADI-PCA and LLSG is worst when too aggressive hyper-parameters are used. We notice how their curves move upward in panel b withrespect to ADI median subtraction, SODIRF, and SODINN curves. Panel c is generated by injecting fainter companions with respect to panel b. A higher planet-to-star contrast interval is a more sensible choice for highlighting the relative sensitivity of the studied algorithms.
Current usage metrics show cumulative count of Article Views (full-text article views including HTML views, PDF and ePub downloads, according to the available data) and Abstracts Views on Vision4Press platform.
Data correspond to usage on the plateform after 2015. The current usage metrics is available 48-96 hours after online publication and is updated daily on week days.
Initial download of the metrics may take a while.