Fig. 2
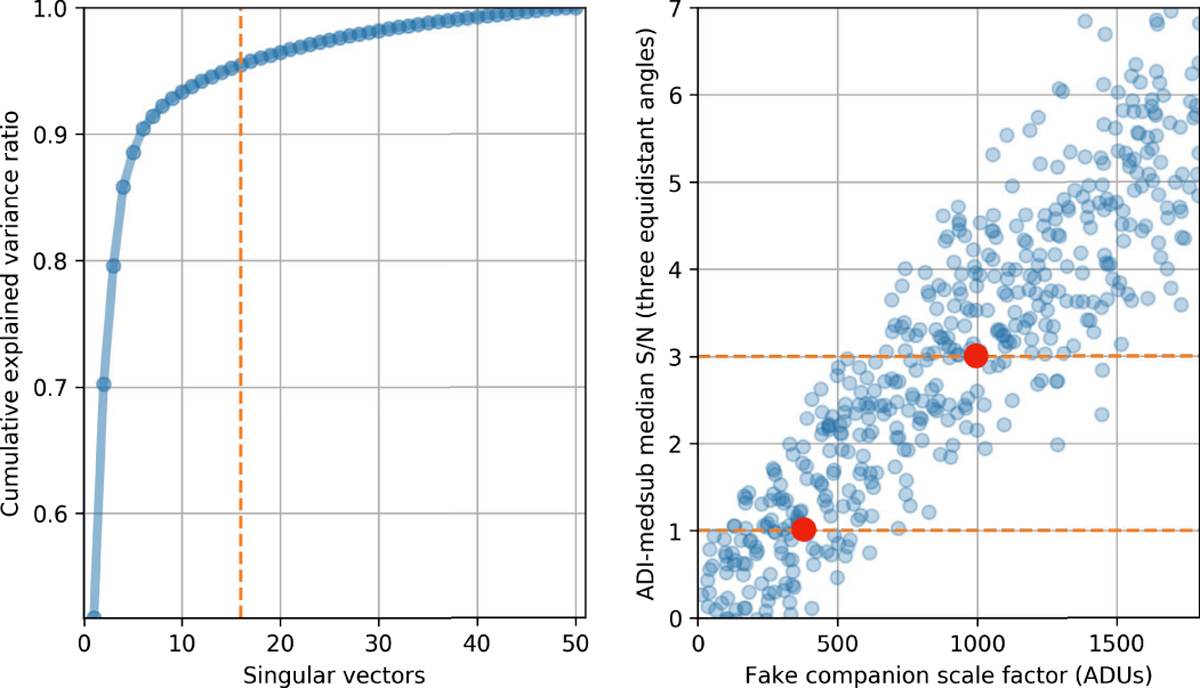
Generation of a labeled dataset. Left panel: procedure for determining the approximation levels and shows the cumulative explained variance ratio as defined by Eq. (4). The vertical dotted line is located at the maximum number (16)of singular vectors used in this case. Right panel: determination of flux intervals and shows the median S/N of injected companions, in an ADI-median-subtracted residual frame, as a function of the scaling factor. The red dots denote the lower and upper bounds of the companion injections for generating MLAR samples of the positive class.
Current usage metrics show cumulative count of Article Views (full-text article views including HTML views, PDF and ePub downloads, according to the available data) and Abstracts Views on Vision4Press platform.
Data correspond to usage on the plateform after 2015. The current usage metrics is available 48-96 hours after online publication and is updated daily on week days.
Initial download of the metrics may take a while.