Fig. A.2
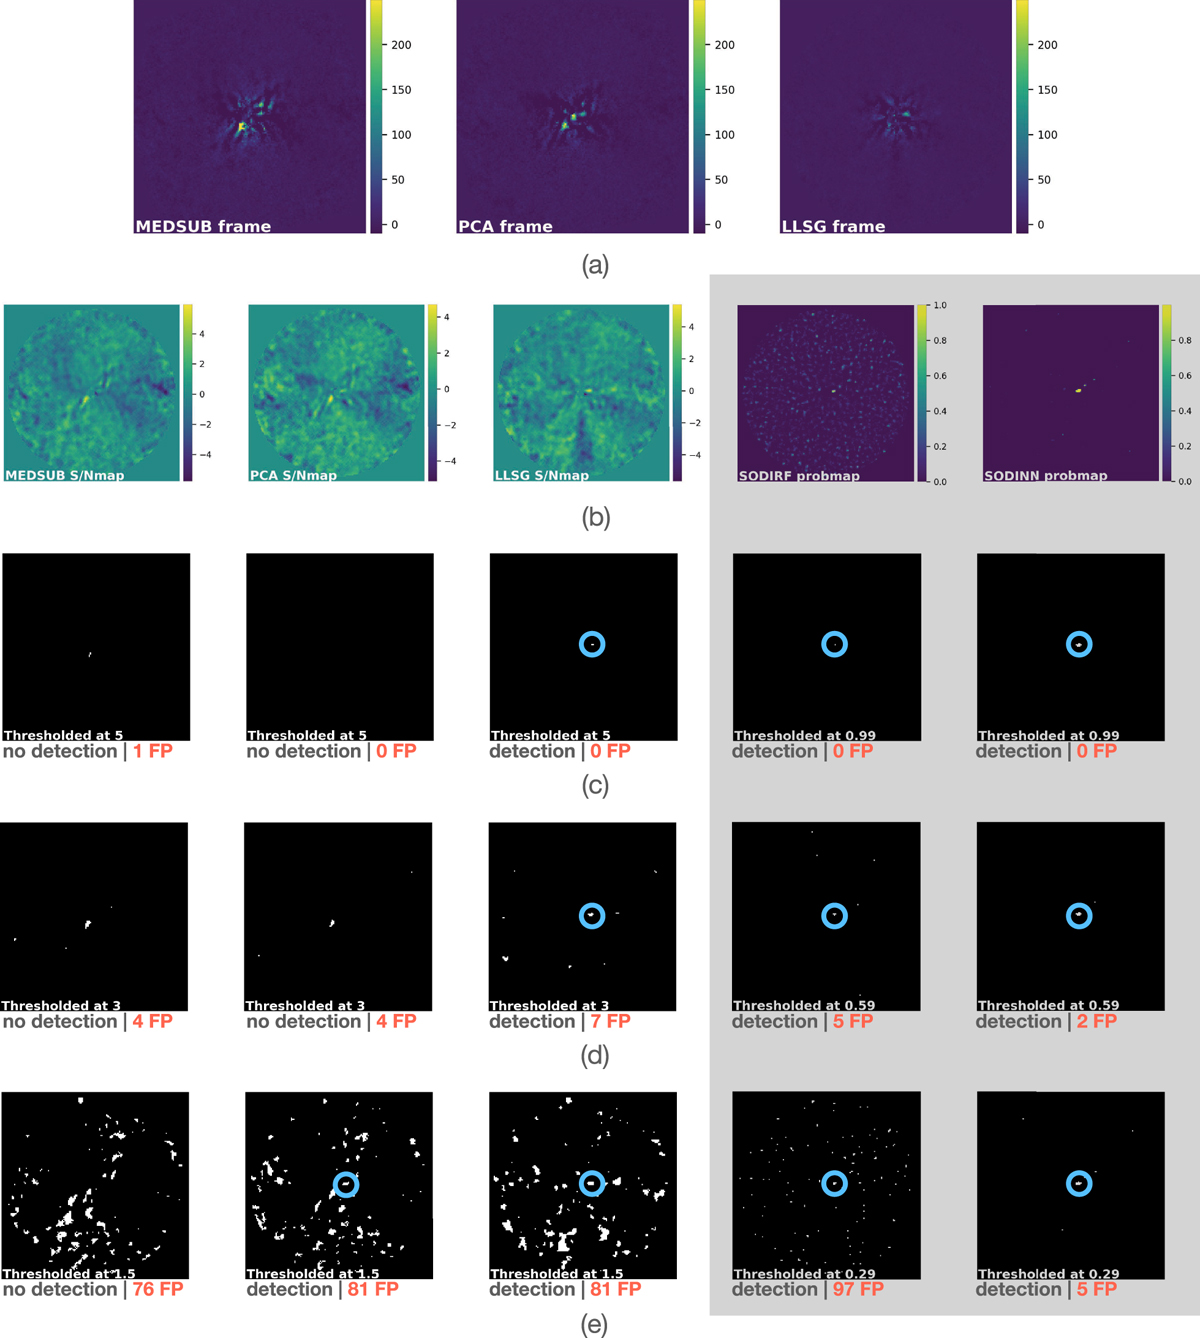
Case of a single injection for building a ROC-curve comparative analysis. Panel a: groups the final residual frames for the model PSF subtraction approaches (ADI median subtraction, ADI-PCA and LLSG). Detection maps are shown in panel b: S/N maps from the residual flux frames of panel a and probability maps of SODIRFand SODINN. Panels c–e: binary maps obtained from the thresholded S/N and probability maps of panel b. The detected fake companion is shown with a blue circle on the binary maps. The detection state and the number of FPs are also shown next to each binary map. We highlight that the number of FPs grows when τ is decreasedand also that SODINN controls the number of FPs. A large number of these injections (with varying flux and position) need to be performed in order to build the ROC curves.
Current usage metrics show cumulative count of Article Views (full-text article views including HTML views, PDF and ePub downloads, according to the available data) and Abstracts Views on Vision4Press platform.
Data correspond to usage on the plateform after 2015. The current usage metrics is available 48-96 hours after online publication and is updated daily on week days.
Initial download of the metrics may take a while.