Fig. 6
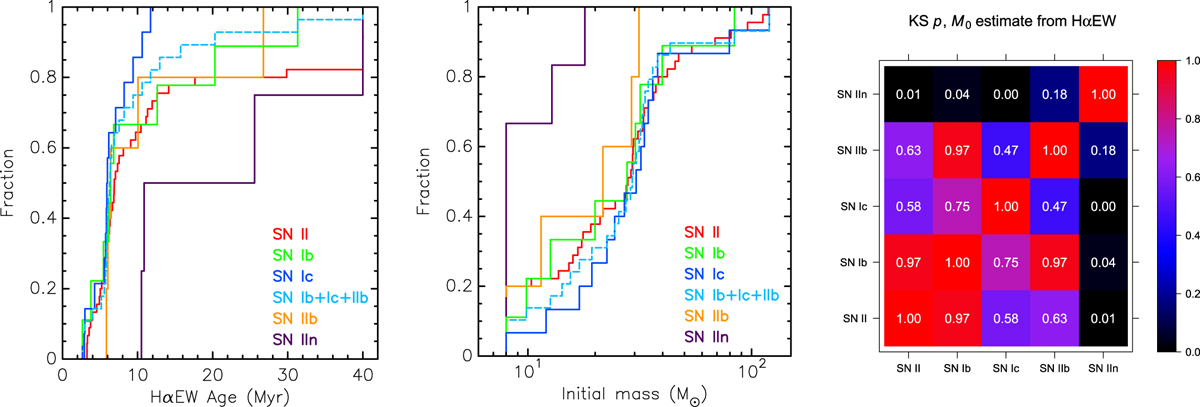
Left and centre: observed cumulative distribution of parent stellar population age and progenitor initial mass for different SN subtypes. SN sites which show no Hα emission are plotted as having an age of 40 Myr, corresponding to the single-star SN progenitor lower mass limit of 8 M⊙. Right: matrix for K–S test result. The colour-coding is the same as in Fig. 3.
Current usage metrics show cumulative count of Article Views (full-text article views including HTML views, PDF and ePub downloads, according to the available data) and Abstracts Views on Vision4Press platform.
Data correspond to usage on the plateform after 2015. The current usage metrics is available 48-96 hours after online publication and is updated daily on week days.
Initial download of the metrics may take a while.