Free Access
Fig. 9
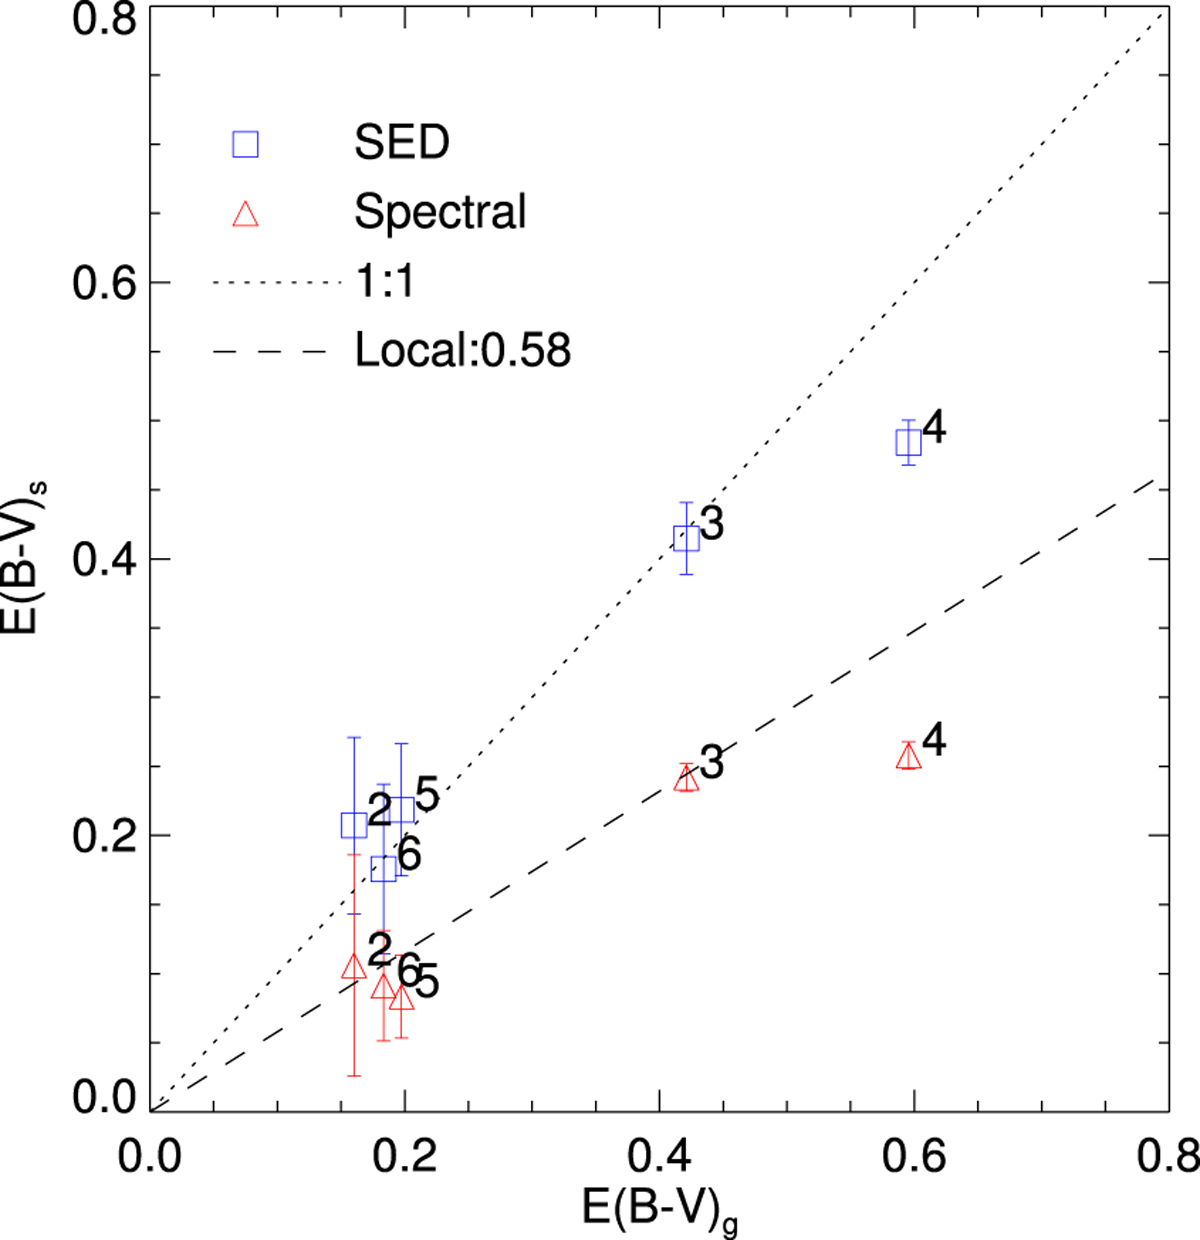
Comparison of the ![]() derived fromthe Balmer decrement with the
derived fromthe Balmer decrement with the ![]() derived from the SED fitting (squares) and the spectral fitting (triangles). The dotted line indicates the 1:1 ratio. The dashed line shows the local value (0.58) of
derived from the SED fitting (squares) and the spectral fitting (triangles). The dotted line indicates the 1:1 ratio. The dashed line shows the local value (0.58) of ![]() given by Pannella et al. (2015).
given by Pannella et al. (2015).
Current usage metrics show cumulative count of Article Views (full-text article views including HTML views, PDF and ePub downloads, according to the available data) and Abstracts Views on Vision4Press platform.
Data correspond to usage on the plateform after 2015. The current usage metrics is available 48-96 hours after online publication and is updated daily on week days.
Initial download of the metrics may take a while.