Fig. 9
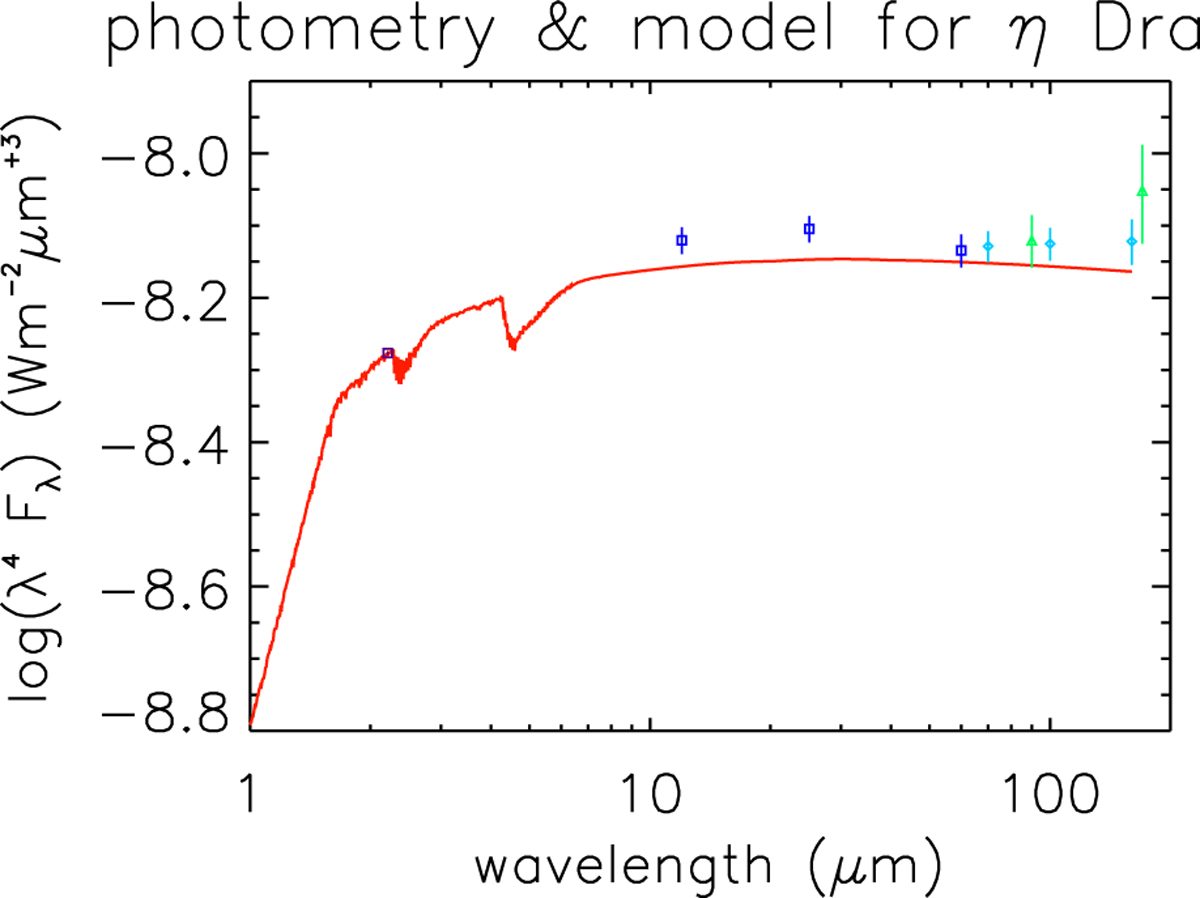
Investigation of the discrepancy of the η Dra Hammersley et al. (1998) model and measured FIR photometry. For a better zoom-in over a large wavelength range, log10 (λ4 × fλ) is displayed. The red line is the model, absolutely calibrated at 2.208 μm (Kn magnitude = 0.62 ± 0.005 mag, c.f. Cohen et al. (1999), Selby et al. 1988) as represented by the violet square symbol. Dark-blue squares, light-blue diamonds, and green triangles represent IRAS FSC, PACS, and ISOPHOT HPDP photometry and their respective uncertainties. This photometry has been colour-corrected for a 5000 K blackbody spectrum.
Current usage metrics show cumulative count of Article Views (full-text article views including HTML views, PDF and ePub downloads, according to the available data) and Abstracts Views on Vision4Press platform.
Data correspond to usage on the plateform after 2015. The current usage metrics is available 48-96 hours after online publication and is updated daily on week days.
Initial download of the metrics may take a while.