Fig. 8
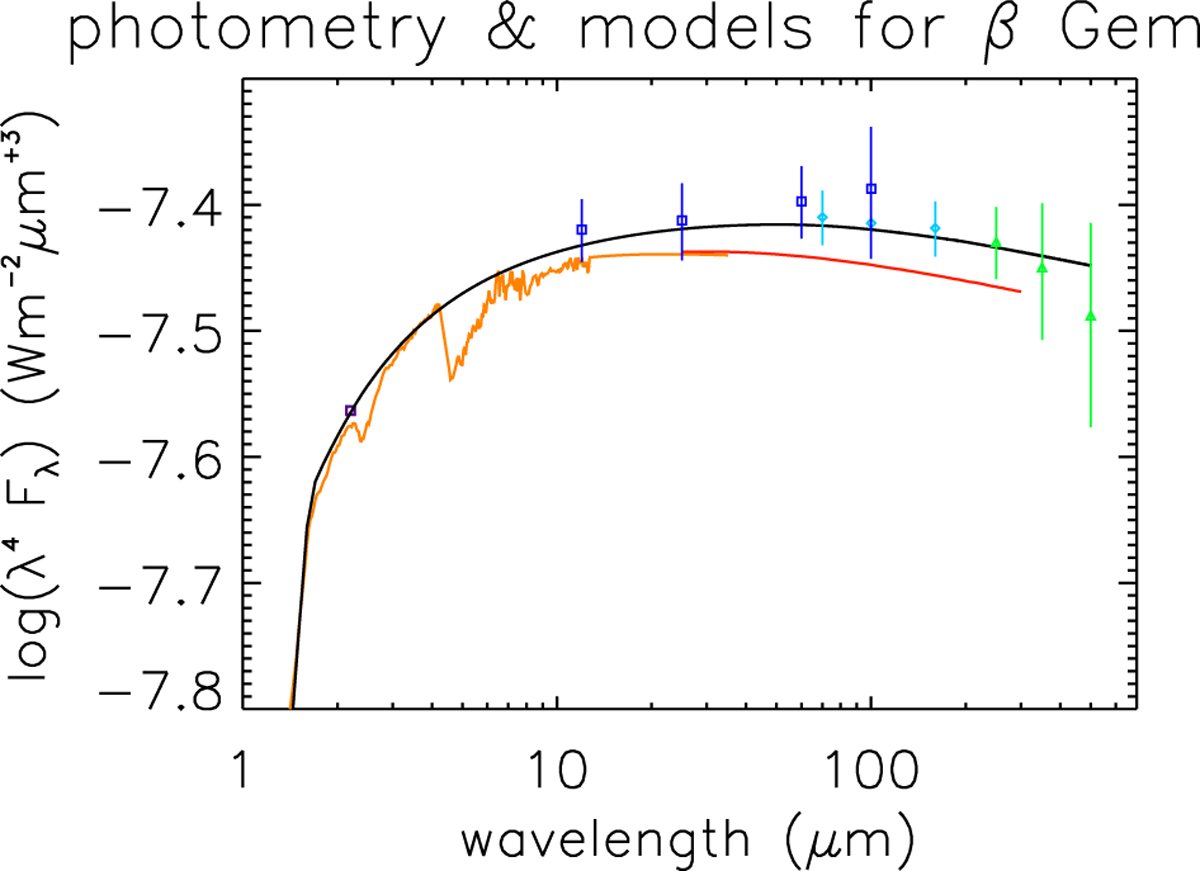
Investigation of the discrepancy of the β Gem Cohen et al. (1996) model and measured FIR photometry. For a better zoom-in over a large wavelength range, log10 (λ4 × fλ) is displayed. The orange and red lines are the Cohen et al. (1995) absolutely calibrated 1.2–35 μm spectral model and the Cohen et al. (1996) FIR extension, respectively. The black line represents a scaled (×0.169) fiducial star continuum model of α Boo (Dehaes et al. 2011). The scaling factor has been derived from the Selby et al. (1988) Kn narrow bandphotometry ratio 10−0.4×(−1.14 + 3.07) and the position of the scaling wavelength (2.205 μm) is indicated by the violet square symbol. We note that the Kn zero point is ≈3% higher than that for the Cohen models (cf. file header of α Boo model (reference, see text) vs Table 1 in Cohen et al. 1992). Dark-blue squares, light-blue diamonds and green triangles represent IRAS FSC, PACS and SPIRE photometry and their respective uncertainties. This photometry has been colour-corrected for a 4500 K blackbody spectrum.
Current usage metrics show cumulative count of Article Views (full-text article views including HTML views, PDF and ePub downloads, according to the available data) and Abstracts Views on Vision4Press platform.
Data correspond to usage on the plateform after 2015. The current usage metrics is available 48-96 hours after online publication and is updated daily on week days.
Initial download of the metrics may take a while.