Fig. 3
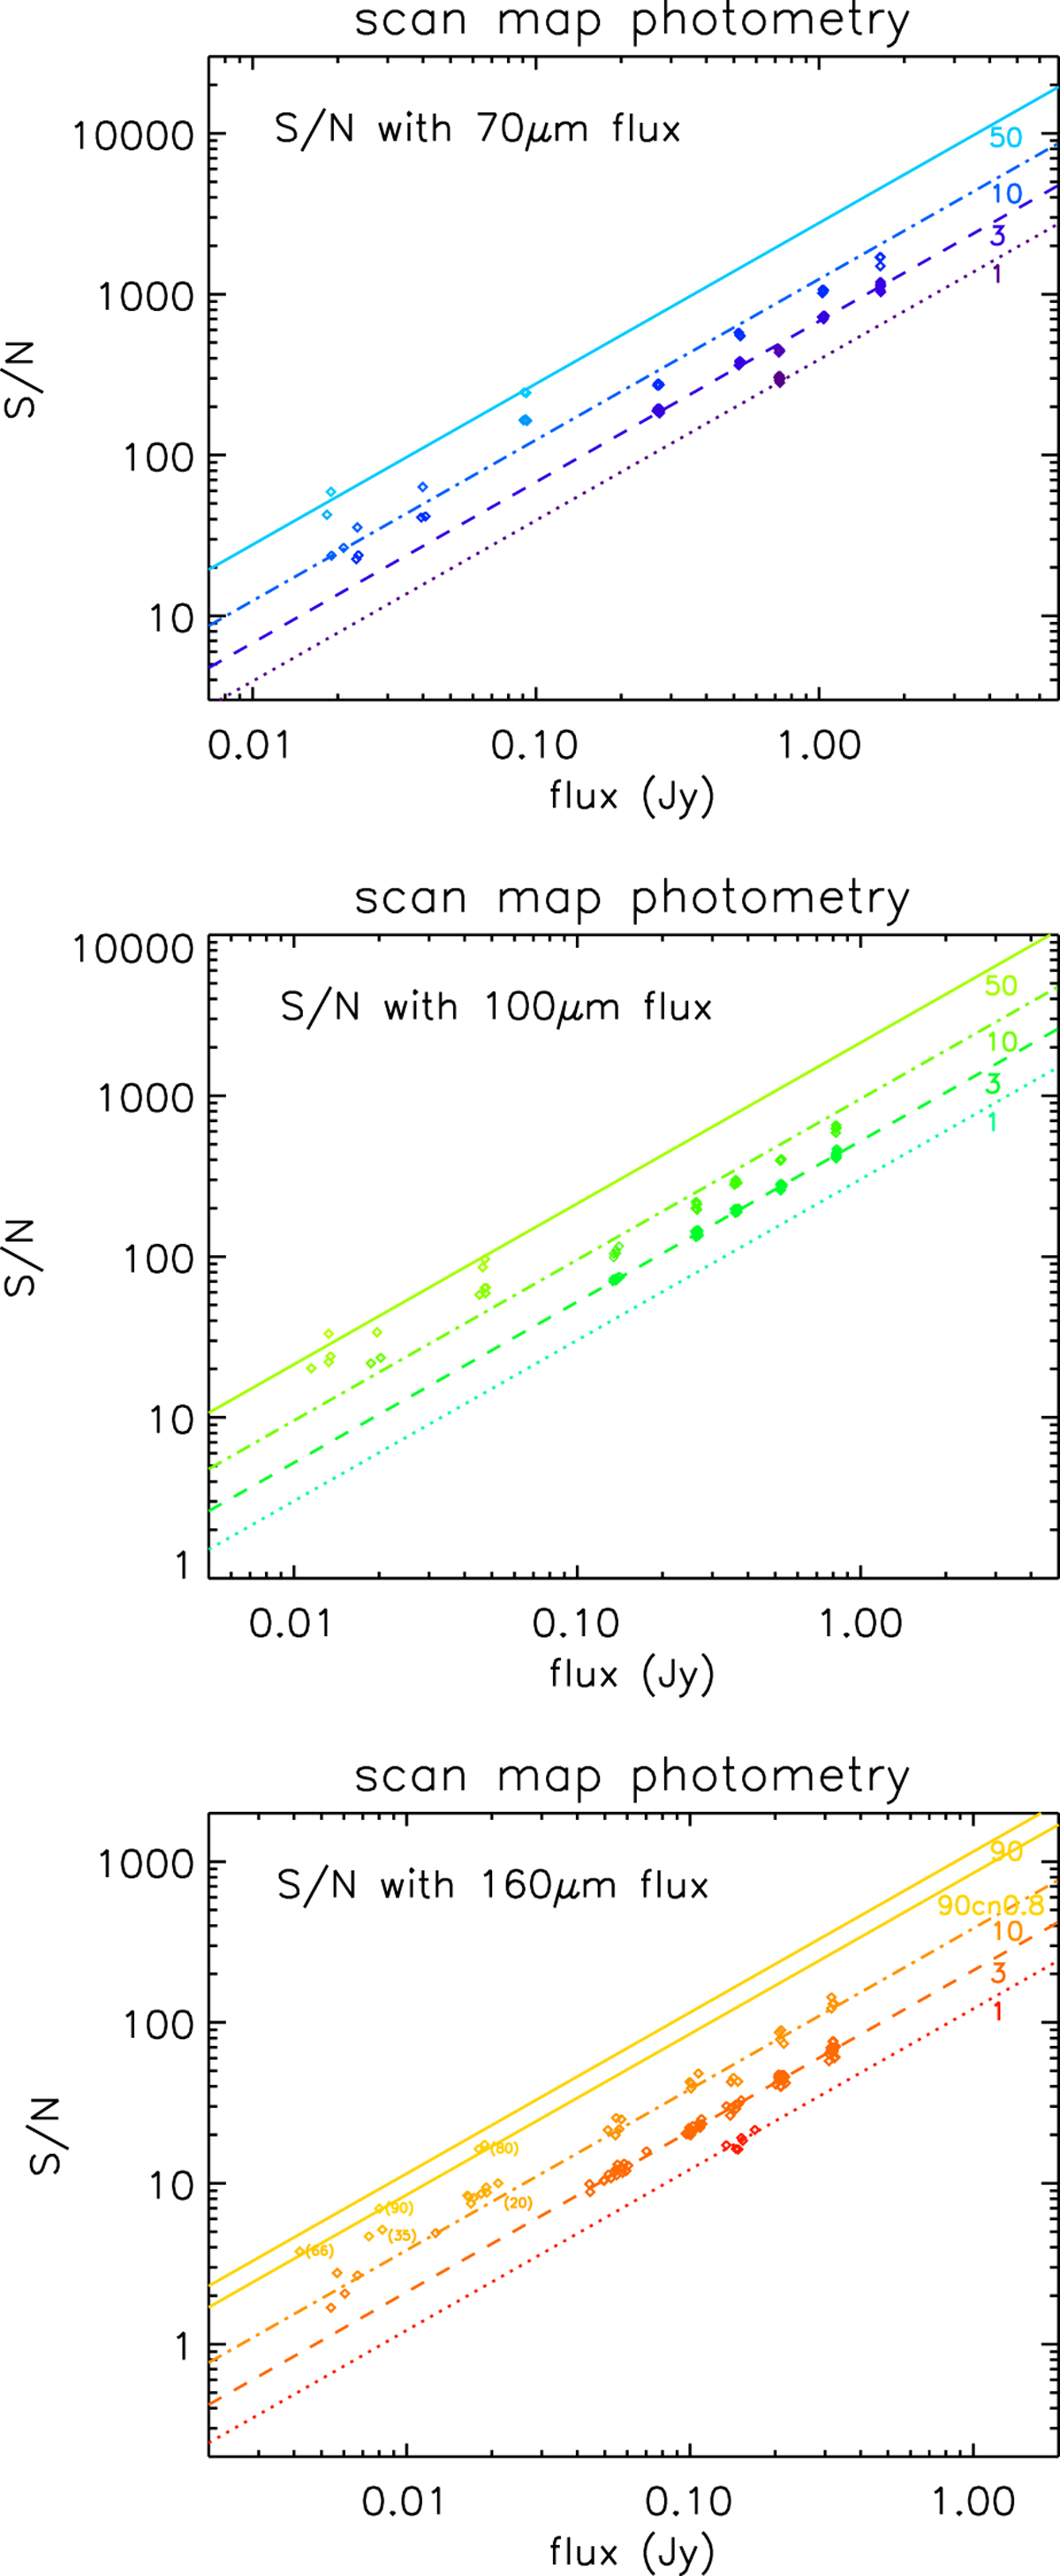
Measured S/Ns for mini-scan-map photometry depending on the source flux (Note: fluxes measured inside the aperture are used here). For better comparability only measurements with an observational set-up identical with the final mini-map set-up (ten 180′′ scan legs with 4′′ separation and scan speed 20′′/s) are considered. Lighter colour tones are measurements with higher scan map repetition factors. We note that here the dotted, dashed, and dashed dotted lines in different colour tones do not represent the S/N prediction by the PACS exposure time calculator of the Herschel observation planning tool HSpot, but are empirical adjustments to the average measured S/N for the respective scan map repetitions. In the 160 μm panel, numbers in parentheses mark measurements with high repetition factors whose S/N is degraded by confusion noise. This is also indicated by two S/N with flux lines for repetition factor 90, where the lower one includes additional confusion noise (cn) of 0.8 mJy.
Current usage metrics show cumulative count of Article Views (full-text article views including HTML views, PDF and ePub downloads, according to the available data) and Abstracts Views on Vision4Press platform.
Data correspond to usage on the plateform after 2015. The current usage metrics is available 48-96 hours after online publication and is updated daily on week days.
Initial download of the metrics may take a while.