Fig. 2
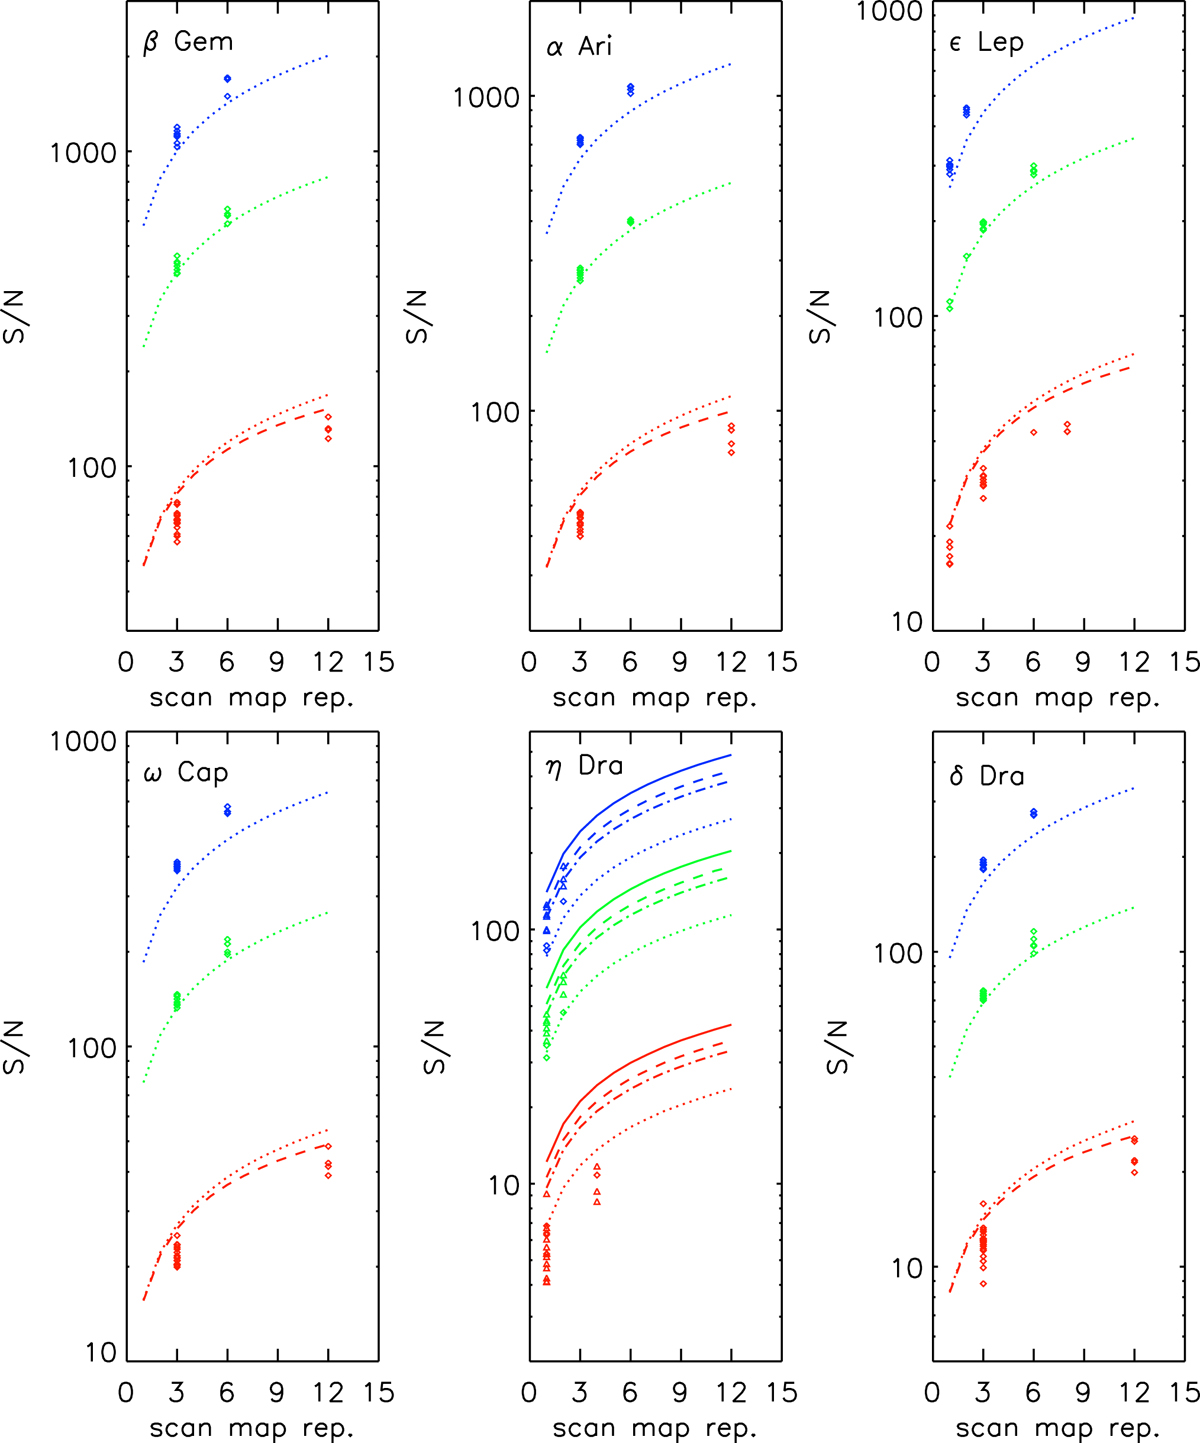
Measured S/Ns for mini-scan-map photometry depending on the number of repetitions. Blue, green, and red symbols represent measurements in the three filters, 70, 100, and 160 μm, respectively. Diamond symbols indicate a scan speed of 20′′/s, triangles a scan speed of 10′′/s. The dotted lines in the respective colours show the S/N prediction by the PACS exposure time calculator of the Herschel observation planning tool HSpot for the measured colour corrected stellar flux. Long dashed red lines indicate the S/N prediction including confusion noise. An exception is the panel of η Dra, where the sets of four dotted, dashed, and dashed-dotted lines represent the sensitivity predictions for four different map parameter combinations; the upper three are with 10′′/s scan speed, the lowest one is with 20′′/s scan speed. For more details, see text.
Current usage metrics show cumulative count of Article Views (full-text article views including HTML views, PDF and ePub downloads, according to the available data) and Abstracts Views on Vision4Press platform.
Data correspond to usage on the plateform after 2015. The current usage metrics is available 48-96 hours after online publication and is updated daily on week days.
Initial download of the metrics may take a while.