Fig. 11
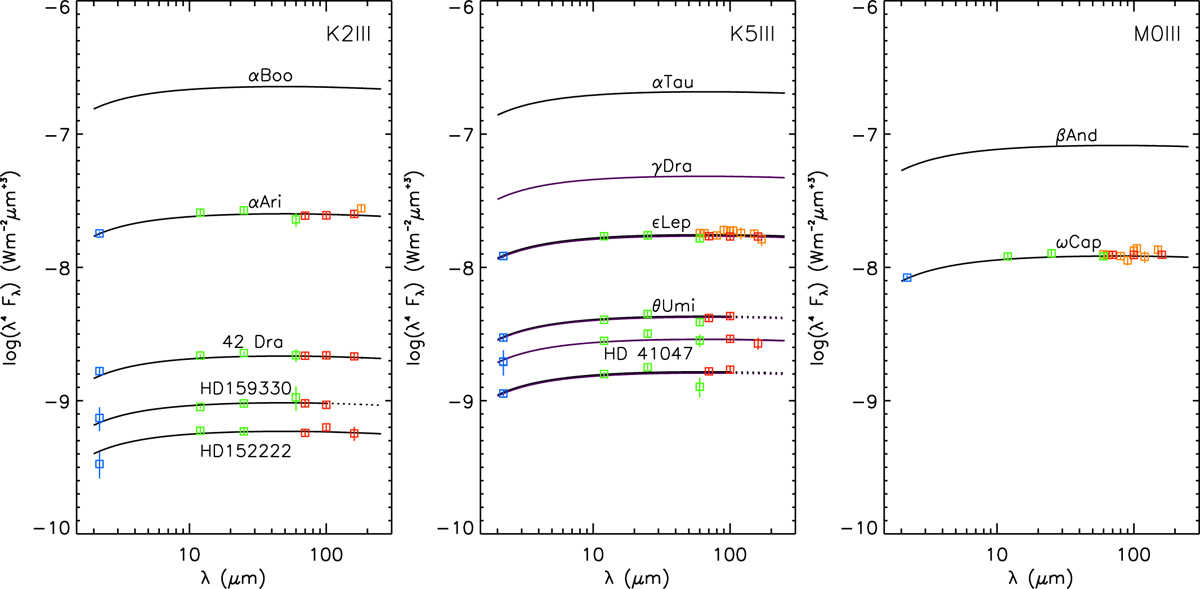
Scaling of PACS fiducial star continuum models (black and purple lines) to the flux level of the primary standard candidates applying the scale factors of Table 12. For a better zoom-in over a large wavelength range, log10 (λ4 × fλ) is displayed. Blue squares are the K-band photometry, green squares are colour-corrected IRAS FSC photometry (Moshir et al. 1989), orange squares are ISOPHOT HPDP photometry (Lemke et al. 1996, see Appendix D) and red squares are PACS photometry. In the middle panel the scaled models of both α Tau (black) and γ Dra (purple) are plotted. Dashed parts of the SEDs of HD 159330, θ Umi, and HD 138265 indicate that these stars are proven reliable standards only up to 100 μm due to background confusion.
Current usage metrics show cumulative count of Article Views (full-text article views including HTML views, PDF and ePub downloads, according to the available data) and Abstracts Views on Vision4Press platform.
Data correspond to usage on the plateform after 2015. The current usage metrics is available 48-96 hours after online publication and is updated daily on week days.
Initial download of the metrics may take a while.