Fig. 10
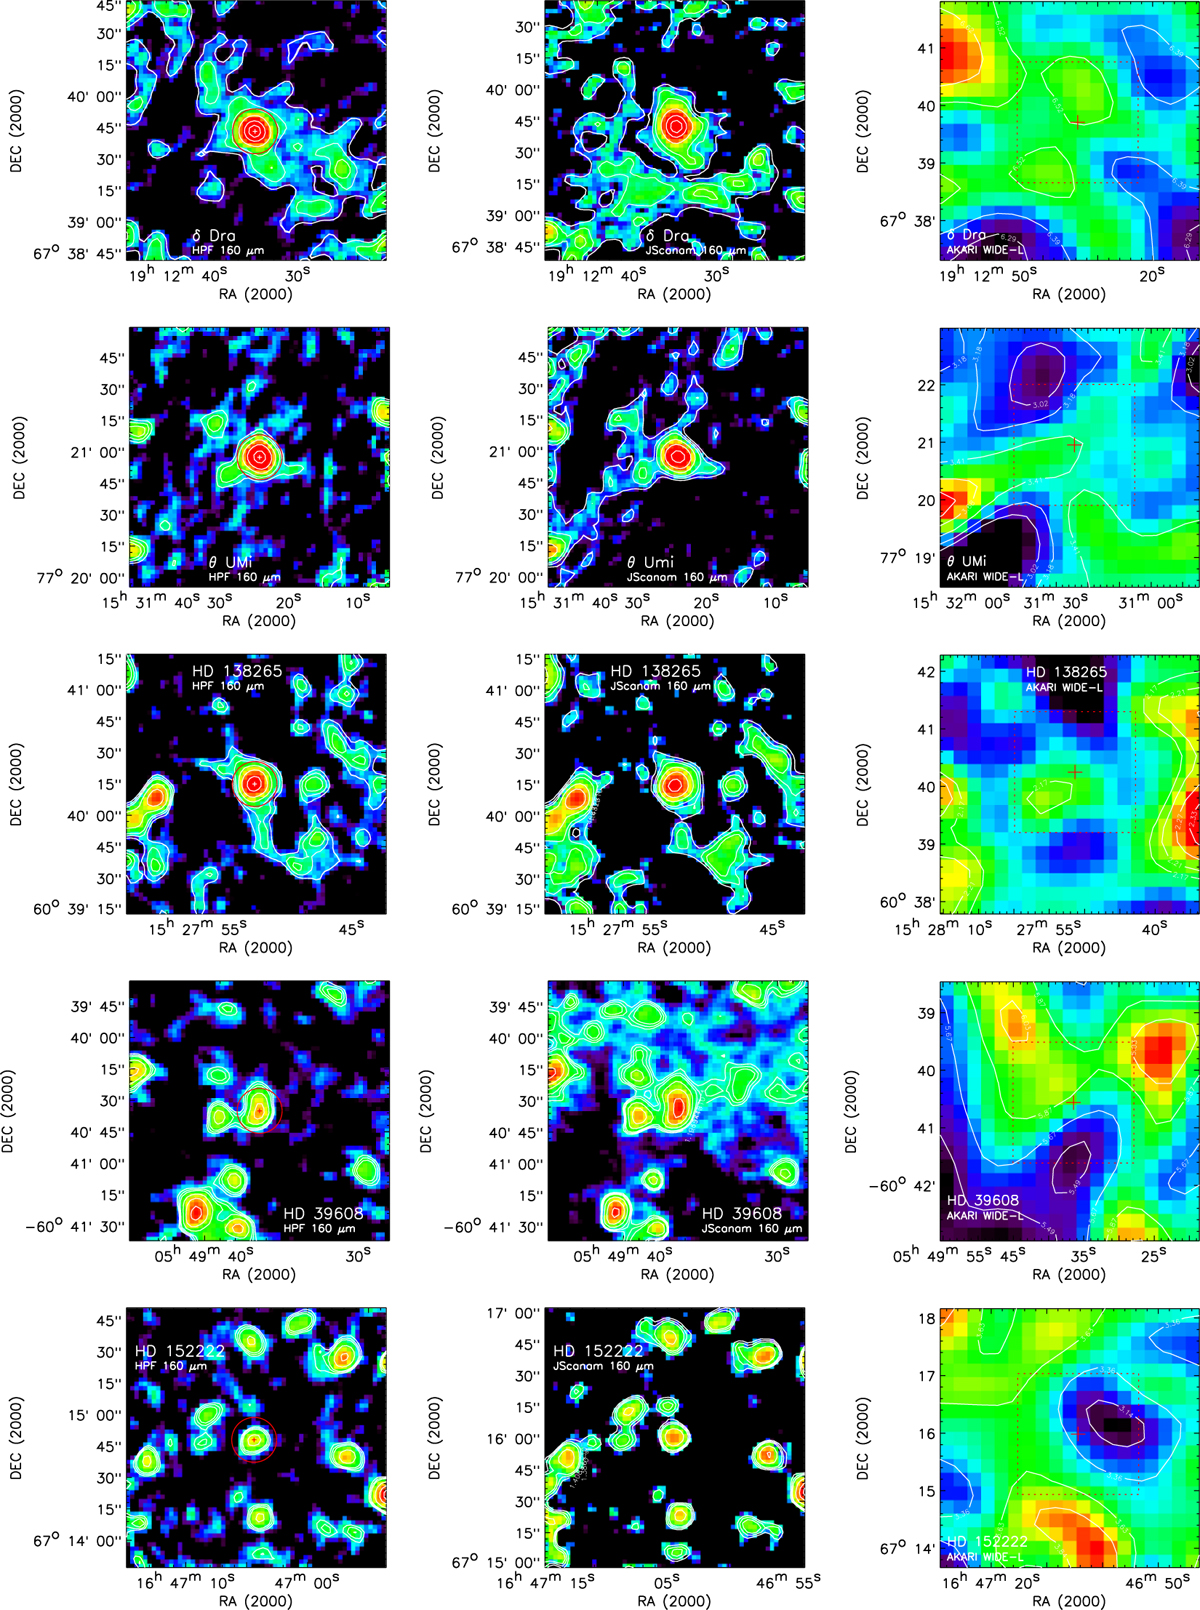
Investigation of the 160 μm sky background structure around the sources δ Dra (OD 934), θ UMi (OD 160), HD 138265 (OD 233), HD 39608 (OD 400) and HD 152222 (OD 843) from top to bottom. The deepest available maps were used, see Table 10 for the OBSID combination and Table A.5, available in electronic form at CDS, for the observation details. The left panel shows the HPF processed map used for the photometry, the photometric aperture with 10.′′ 7 radius is indicated by the red circle and a small red or white cross in its centre. The middle panel shows the JScanam processed map which should reproduce extended emission more reliably. The JScanam map of δ Dra shows thesuperposition of all five sets of OBSIDs in Table 10 (ODs 607, 751, 934, 1198, and 1328) as the deepest image of this field. The right panel shows the AKARI WIDE-L (140 μm) background emission around the source (red cross), the AKARI map area is about four times as large as the PACS map area, which is indicated by the red dashed square.
Current usage metrics show cumulative count of Article Views (full-text article views including HTML views, PDF and ePub downloads, according to the available data) and Abstracts Views on Vision4Press platform.
Data correspond to usage on the plateform after 2015. The current usage metrics is available 48-96 hours after online publication and is updated daily on week days.
Initial download of the metrics may take a while.