Fig. 1
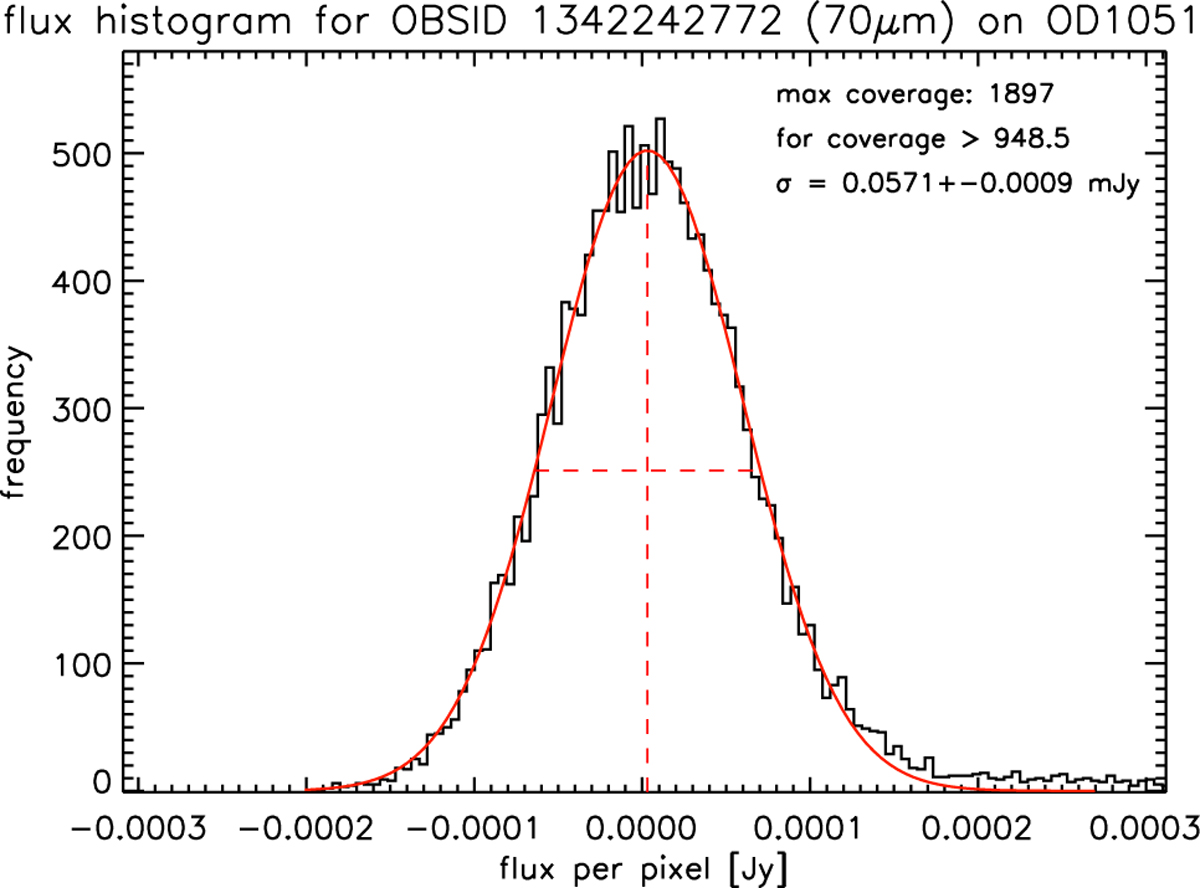
Illustration of the histogram method to determine the background noise. The example shows the number of pixels per flux bin of the 70 μm map of OBSID 1342242772 (β Gem on OD 1051) for all pixels with a coverage value ![]() (>948.5). The displayed flux distribution is cut off towards higher fluxes. The red curve is the Gaussian fit to this histogram. For this fit we took all bins left of the distribution maximum into account, but limited the right fitting range to ten bins beyond the distribution maximum in order to avoid a bias of the fitted width by true source flux. The vertical and horizontal red dashed lines indicate the mean background level and the
(>948.5). The displayed flux distribution is cut off towards higher fluxes. The red curve is the Gaussian fit to this histogram. For this fit we took all bins left of the distribution maximum into account, but limited the right fitting range to ten bins beyond the distribution maximum in order to avoid a bias of the fitted width by true source flux. The vertical and horizontal red dashed lines indicate the mean background level and the![]() , respectively. For fluxes per pixel above ≈0.12 mJy the contribution by true sources becomes noticeable.
, respectively. For fluxes per pixel above ≈0.12 mJy the contribution by true sources becomes noticeable.
Current usage metrics show cumulative count of Article Views (full-text article views including HTML views, PDF and ePub downloads, according to the available data) and Abstracts Views on Vision4Press platform.
Data correspond to usage on the plateform after 2015. The current usage metrics is available 48-96 hours after online publication and is updated daily on week days.
Initial download of the metrics may take a while.