Fig. 9
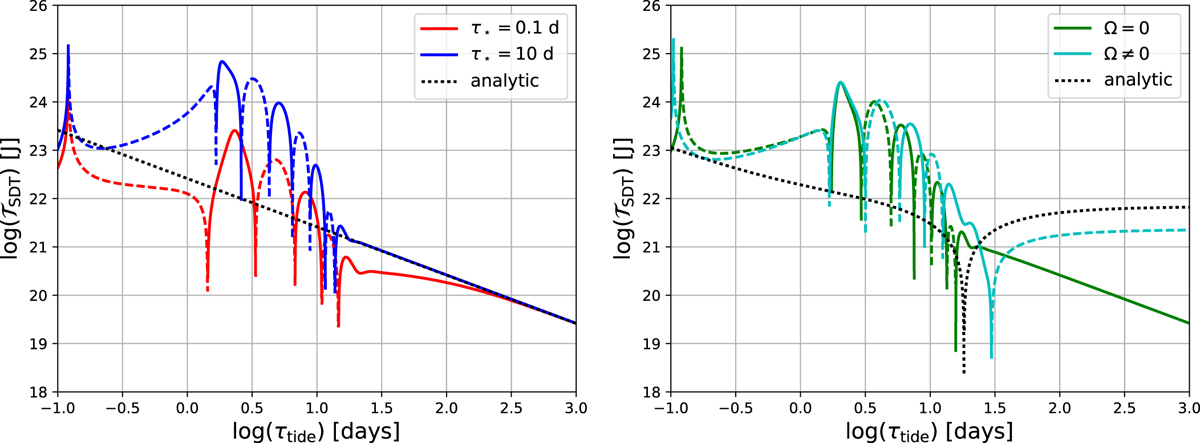
Total tidal torque exerted of the planet (N.m) as a function of the tidal period (days). Left: for two extremal value of the thermal time (τ⋆ = 0.1, 10 days) in the static approximation (Ω = 0).
Right: for τ⋆ = 1 day in the static (Ω = 0) and traditional (Ω≠0) approximations (in this case, Ω is given by Ω = norb + σ ∕ 2 with ![]() and norb = 2π ∕ τorb, see Table 1). In both panels, the torque resulting from the quadrupolar component of the semi-diurnal tide is plotted in logarithmic scale (vertical axis) as a function of the logarithm of
τtide (horizontal scale). Solid (dashed) lines correspond to negative (positive) torques, pushing the planet away (toward) spin-orbit synchronous rotation. The black dotted line designates the equilibrium tidal torque plotted using the analytic formula of Eq. (76). The grey zone corresponds to the region of the spectrum where the rotation rate exceeds the critical Keplerian angular frequency, defined in Sect. 2. Values of parameters used for these calculations are summarized in
Table 1. The vertical structure of the tidal response is integrated on a regular mesh composed of
104 points for the left panel and 103
points for the right panel.
and norb = 2π ∕ τorb, see Table 1). In both panels, the torque resulting from the quadrupolar component of the semi-diurnal tide is plotted in logarithmic scale (vertical axis) as a function of the logarithm of
τtide (horizontal scale). Solid (dashed) lines correspond to negative (positive) torques, pushing the planet away (toward) spin-orbit synchronous rotation. The black dotted line designates the equilibrium tidal torque plotted using the analytic formula of Eq. (76). The grey zone corresponds to the region of the spectrum where the rotation rate exceeds the critical Keplerian angular frequency, defined in Sect. 2. Values of parameters used for these calculations are summarized in
Table 1. The vertical structure of the tidal response is integrated on a regular mesh composed of
104 points for the left panel and 103
points for the right panel.
Current usage metrics show cumulative count of Article Views (full-text article views including HTML views, PDF and ePub downloads, according to the available data) and Abstracts Views on Vision4Press platform.
Data correspond to usage on the plateform after 2015. The current usage metrics is available 48-96 hours after online publication and is updated daily on week days.
Initial download of the metrics may take a while.