Fig. B.1
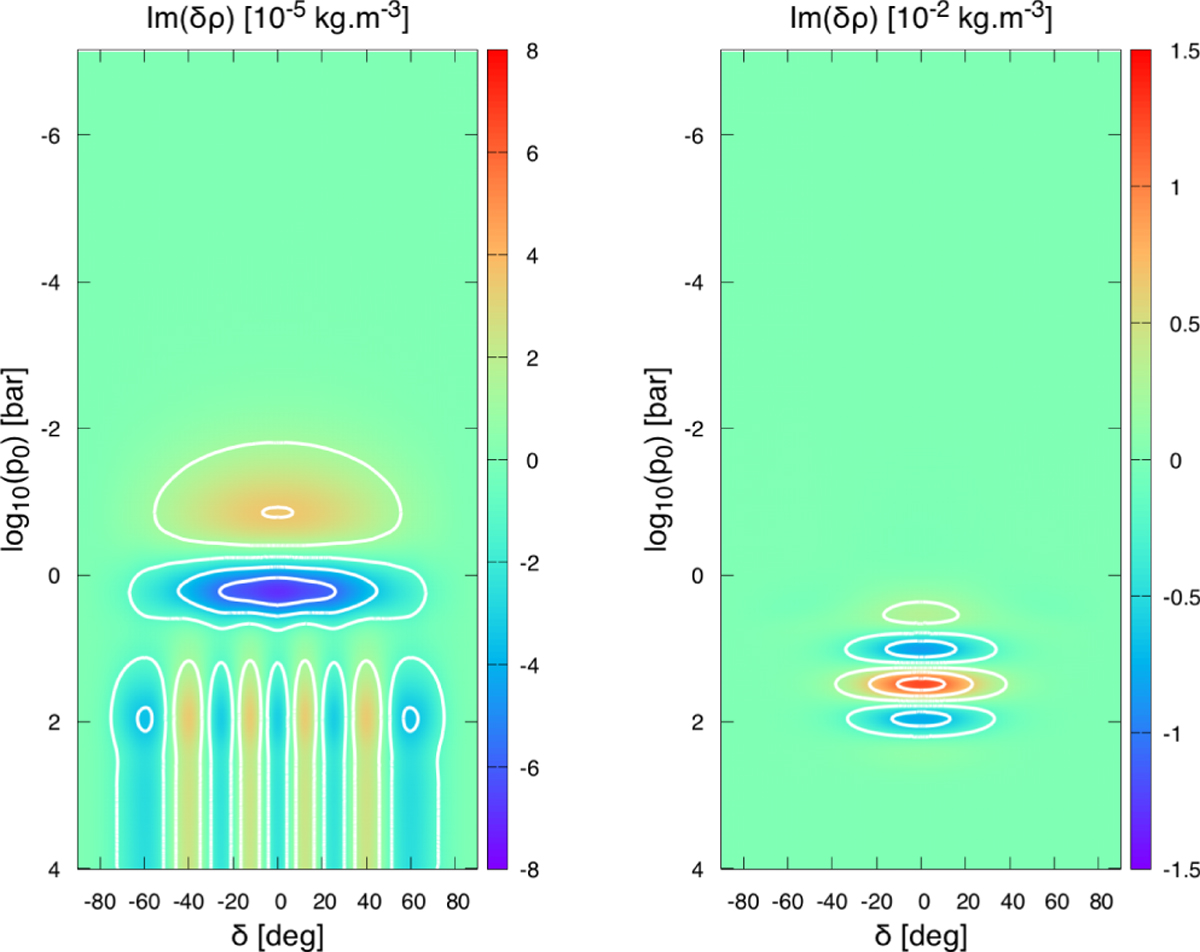
Imaginary part of density fluctuations in the case treated in Fig. 6 for a lower boundary located at the pressure level p0 = 104 bar instead of the centre of the planet as in Fig. 6. The density fluctuations are plotted as a function of latitude (degrees, horizontal axis) and pressure in logarithmic scale (bars, vertical axis) in the case with rotation and radiative cooling and for two different tidal periods, (i) τtide = 0.1 day (left) and (ii) τtide = 10 day (right). The corresponding rotation rates are given by Ω = σ∕2 + norb with ![]() and norb = 2π∕τorb (see Table 1).
and norb = 2π∕τorb (see Table 1).
Current usage metrics show cumulative count of Article Views (full-text article views including HTML views, PDF and ePub downloads, according to the available data) and Abstracts Views on Vision4Press platform.
Data correspond to usage on the plateform after 2015. The current usage metrics is available 48-96 hours after online publication and is updated daily on week days.
Initial download of the metrics may take a while.