Fig. 10
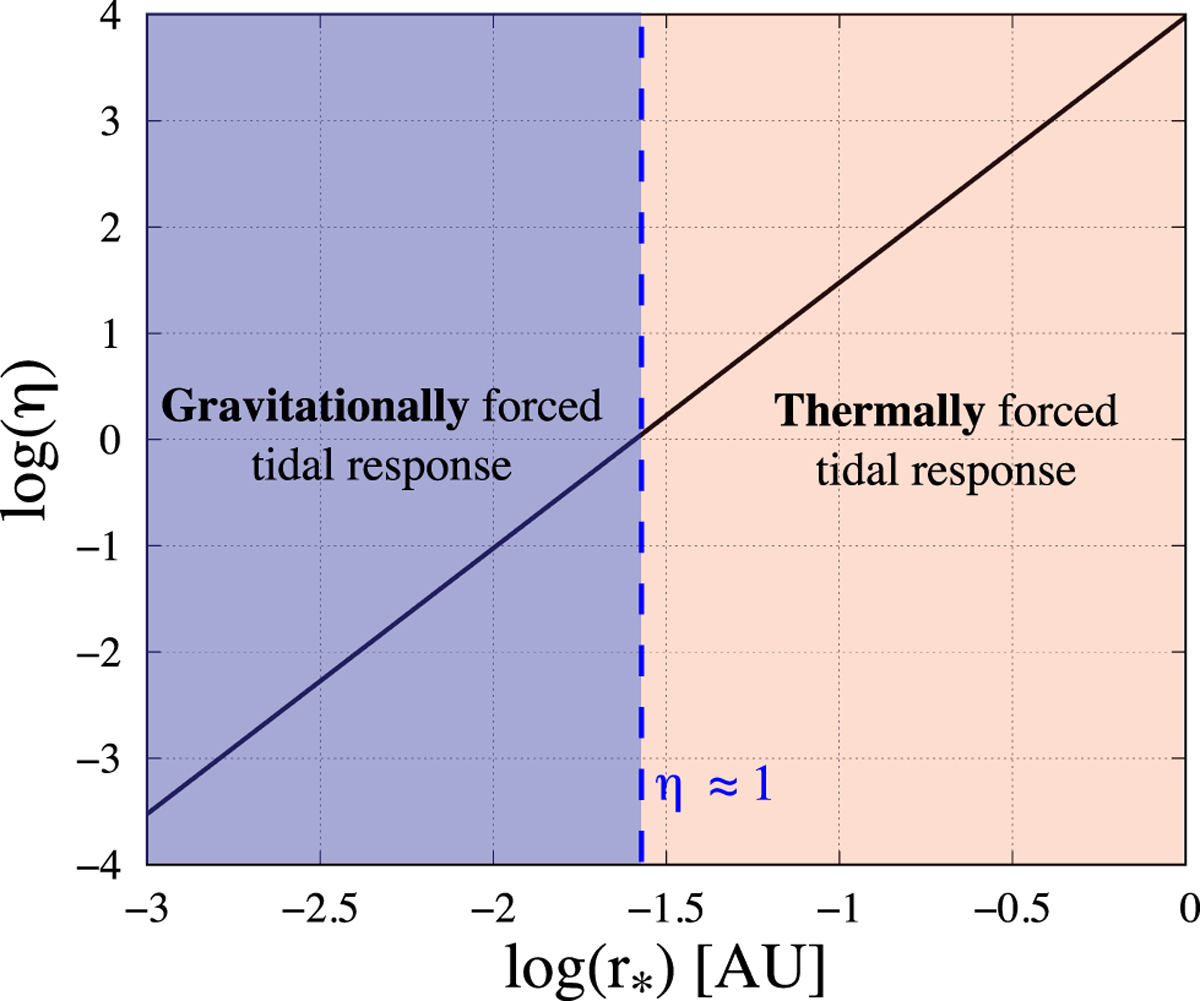
Regions where the tidal response of the radiative layer is dominated by the gravitational (blue area) and thermal (red area) components of the forcing in the zero-frequency limit (σ → 0). The logarithm of the ratio η given by Eq. (79) (black solid line) is plotted as a function of the star-planet distance r⋆ (AU) in logarithmic scale. The blue dashed line designates the critical distance at which the two components are of the same order of magnitude (η ≈ 1).
Current usage metrics show cumulative count of Article Views (full-text article views including HTML views, PDF and ePub downloads, according to the available data) and Abstracts Views on Vision4Press platform.
Data correspond to usage on the plateform after 2015. The current usage metrics is available 48-96 hours after online publication and is updated daily on week days.
Initial download of the metrics may take a while.