Fig. 8
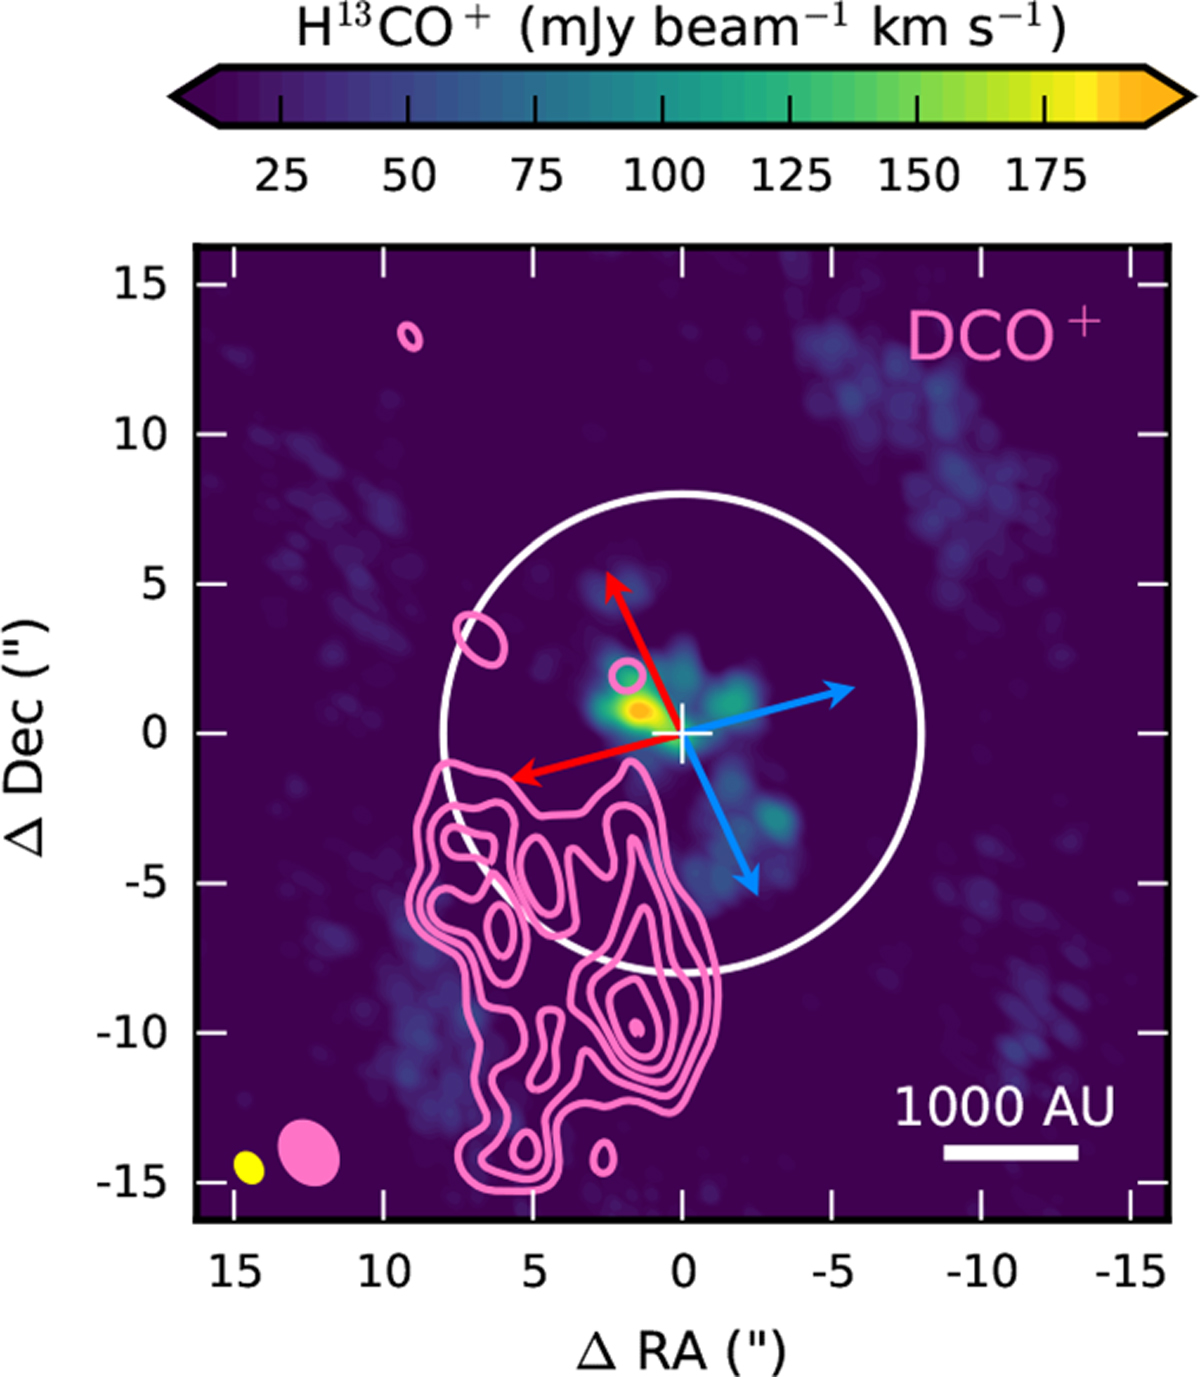
Integrated intensity map for the H13CO+ J = 3 − 2 transition (color scale) toward IRAS2A. The DCO+ J = 2 − 1 transition is overlaid in pink contours. Contours are shown in steps of 1σ starting from a 3σ level (15 mJy beam−1 km s−1). The beams are depicted in the bottom left corner. The position of the continuum peak is indicated by a white cross and the outflow axes by red and blue arrows. The length of the arrows is the same as in Fig. 2 to compare the scales. The solid white contour represents the CO snowline radius predicted by the chemical model for the Kristensen et al. (2012) temperature profile (~2000 AU).
Current usage metrics show cumulative count of Article Views (full-text article views including HTML views, PDF and ePub downloads, according to the available data) and Abstracts Views on Vision4Press platform.
Data correspond to usage on the plateform after 2015. The current usage metrics is available 48-96 hours after online publication and is updated daily on week days.
Initial download of the metrics may take a while.