Free Access
Fig. 7
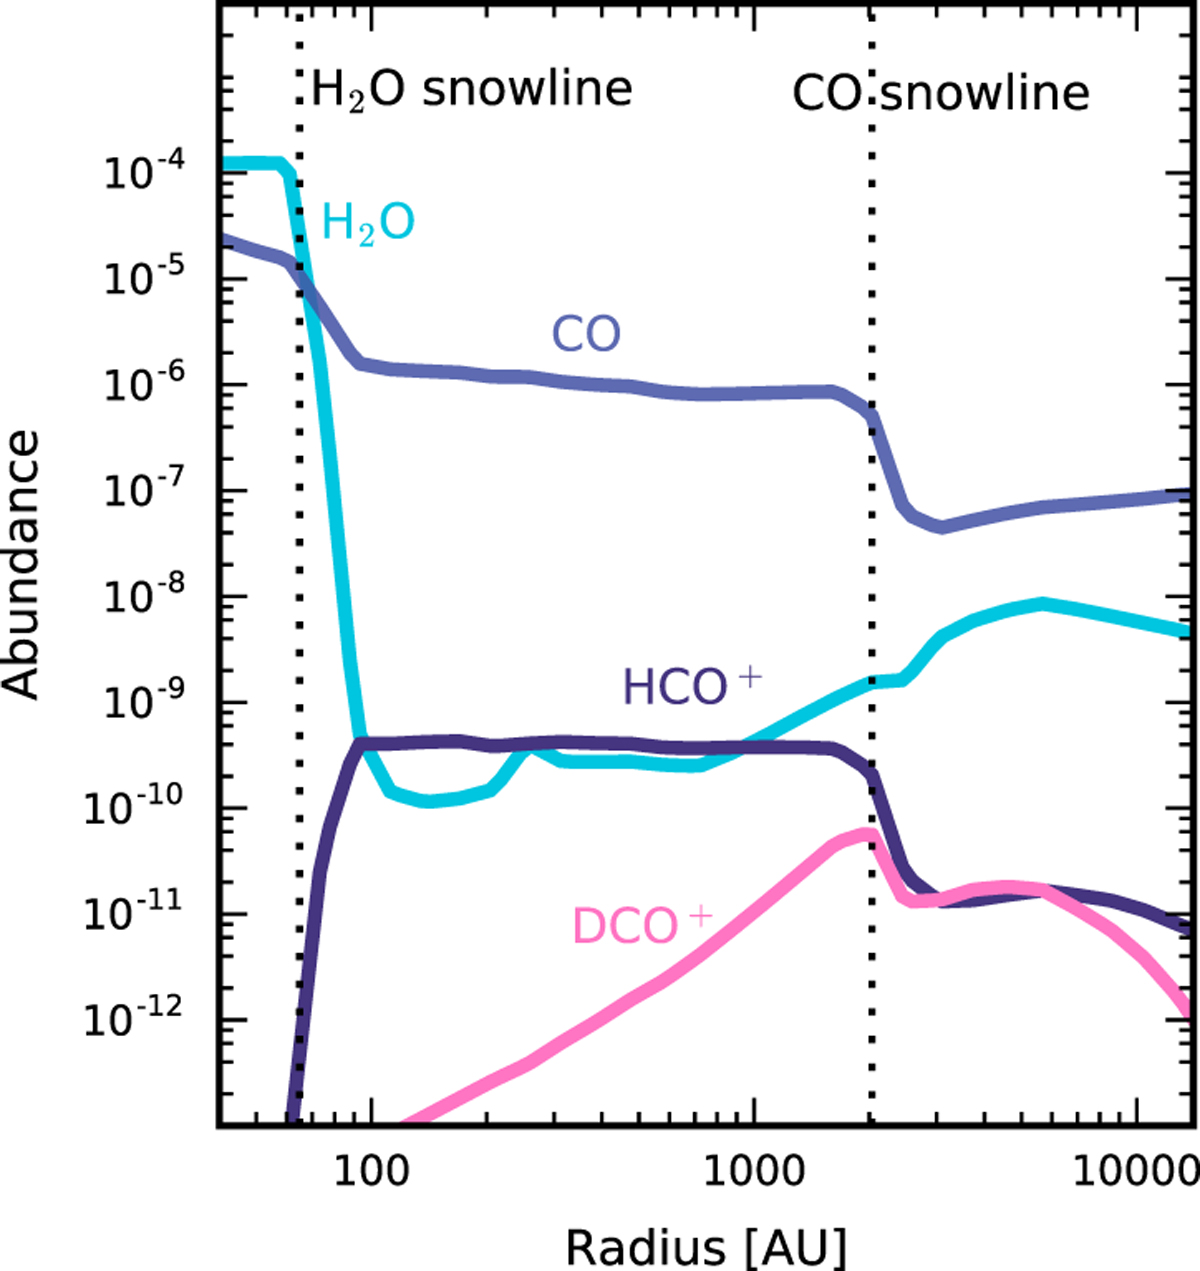
H2O (light blue), CO (blue), HCO+ (purple), and DCO+ (pink) abundances predicted by the GRAINOBLE model for the IRAS2A temperature and density profile from Kristensen et al. (2012). The vertical dotted lines indicate the H2 O and CO snowlines.
Current usage metrics show cumulative count of Article Views (full-text article views including HTML views, PDF and ePub downloads, according to the available data) and Abstracts Views on Vision4Press platform.
Data correspond to usage on the plateform after 2015. The current usage metrics is available 48-96 hours after online publication and is updated daily on week days.
Initial download of the metrics may take a while.