Fig. 6
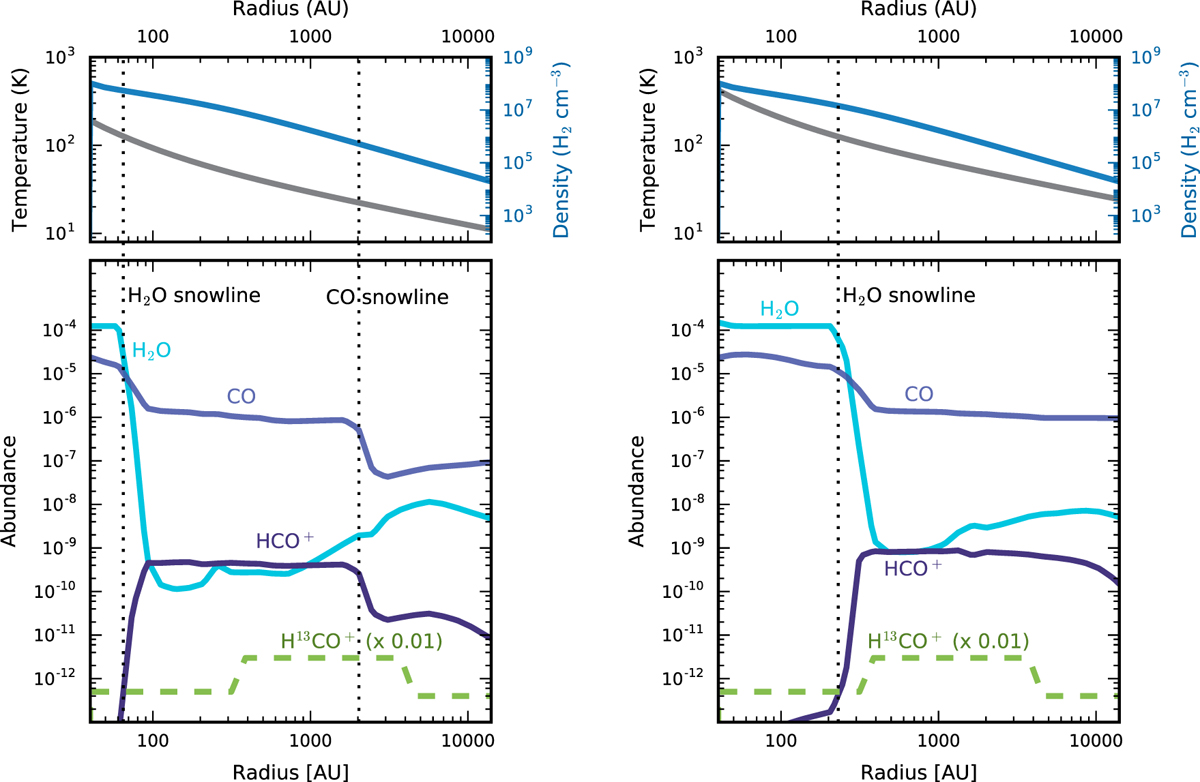
Left panels: temperature (gray) and density (blue) profiles for the IRAS2A envelope from Kristensen et al. (2012) (top), and the corresponding H2O (light blue), CO (blue), and HCO+ (purple) abundances predicted by the GRAINOBLE model (bottom). The dashed green line shows the empirically inferred abundance profile for H13CO+ (scaled down by a factor 100). Right panels: as left panels, but with the temperature increased by a factor 2.2. The vertical dotted lines indicate the H2 O and CO snowlines.
Current usage metrics show cumulative count of Article Views (full-text article views including HTML views, PDF and ePub downloads, according to the available data) and Abstracts Views on Vision4Press platform.
Data correspond to usage on the plateform after 2015. The current usage metrics is available 48-96 hours after online publication and is updated daily on week days.
Initial download of the metrics may take a while.