Fig. 4
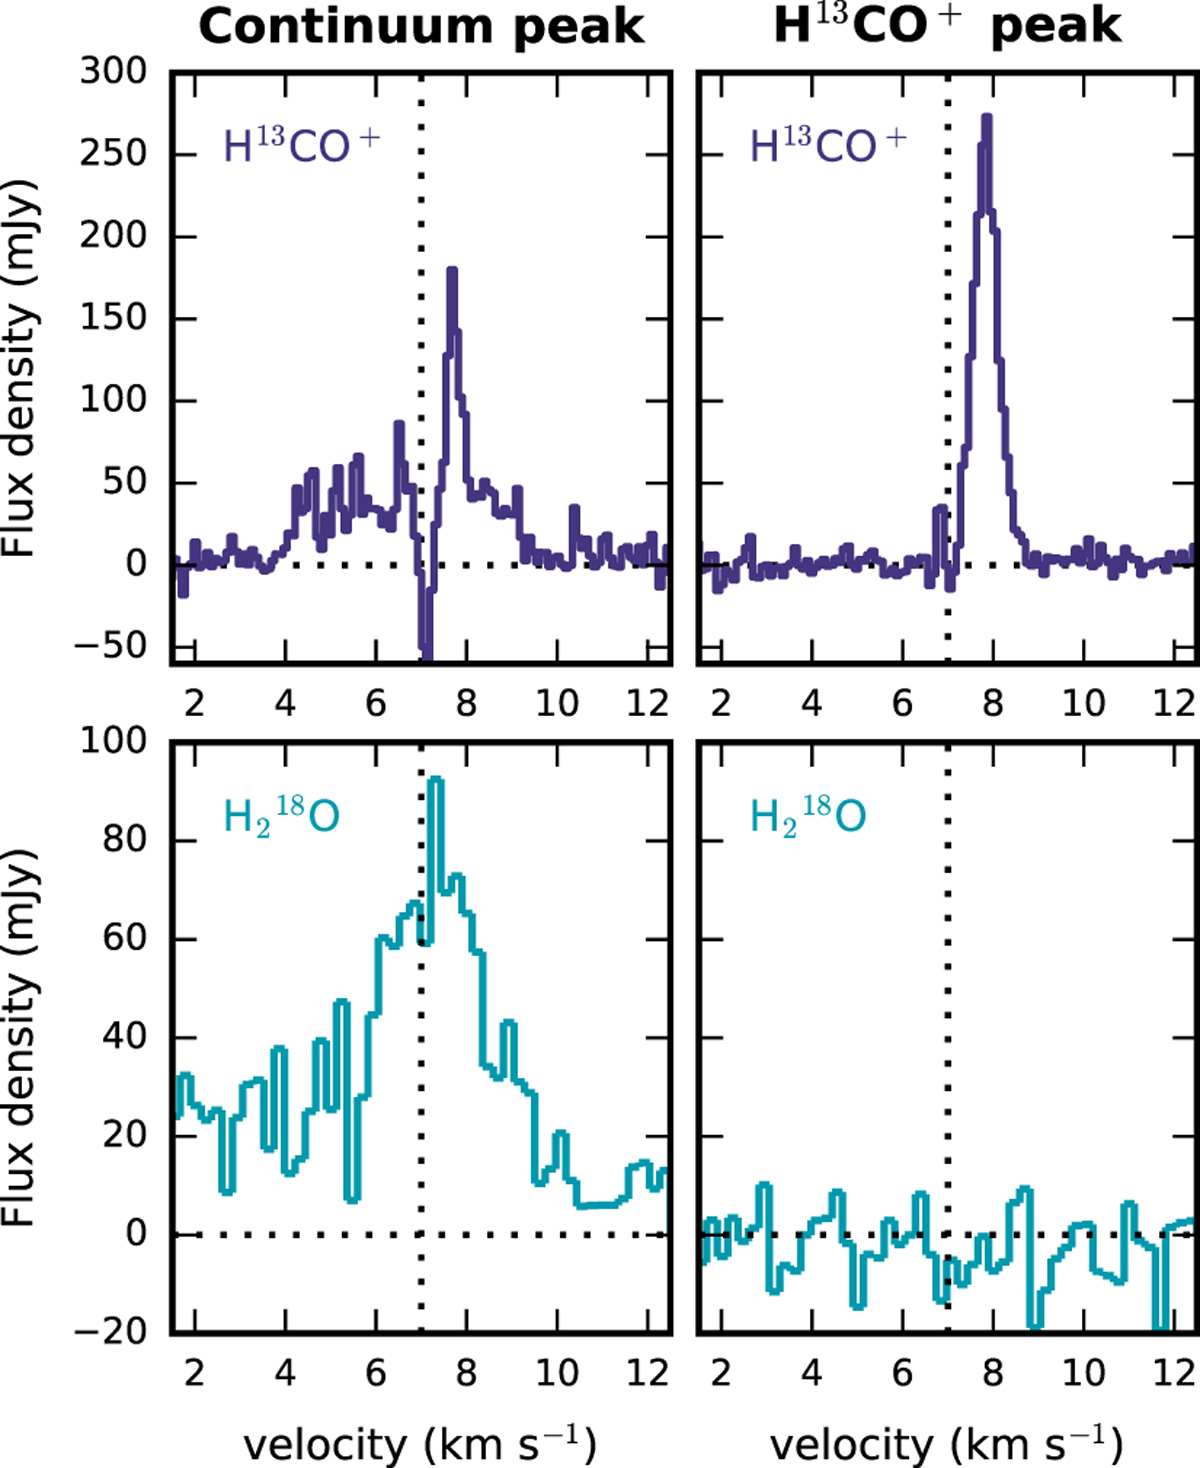
Spectra extracted in a beam toward the continuum peak position (left panels) and the H13CO+ peak position (~2′′ NE of the continuum peak, right panels). The top panels show the H13CO+ J = 3 − 2 transition and the bottom panels the H![]() O 31,3 − 22,0 transition. The two spectra for each species are shown on the same vertical scale. The systemic velocity is indicated by the vertical dotted line at vlsr ≈ 7 km s−1.
O 31,3 − 22,0 transition. The two spectra for each species are shown on the same vertical scale. The systemic velocity is indicated by the vertical dotted line at vlsr ≈ 7 km s−1.
Current usage metrics show cumulative count of Article Views (full-text article views including HTML views, PDF and ePub downloads, according to the available data) and Abstracts Views on Vision4Press platform.
Data correspond to usage on the plateform after 2015. The current usage metrics is available 48-96 hours after online publication and is updated daily on week days.
Initial download of the metrics may take a while.