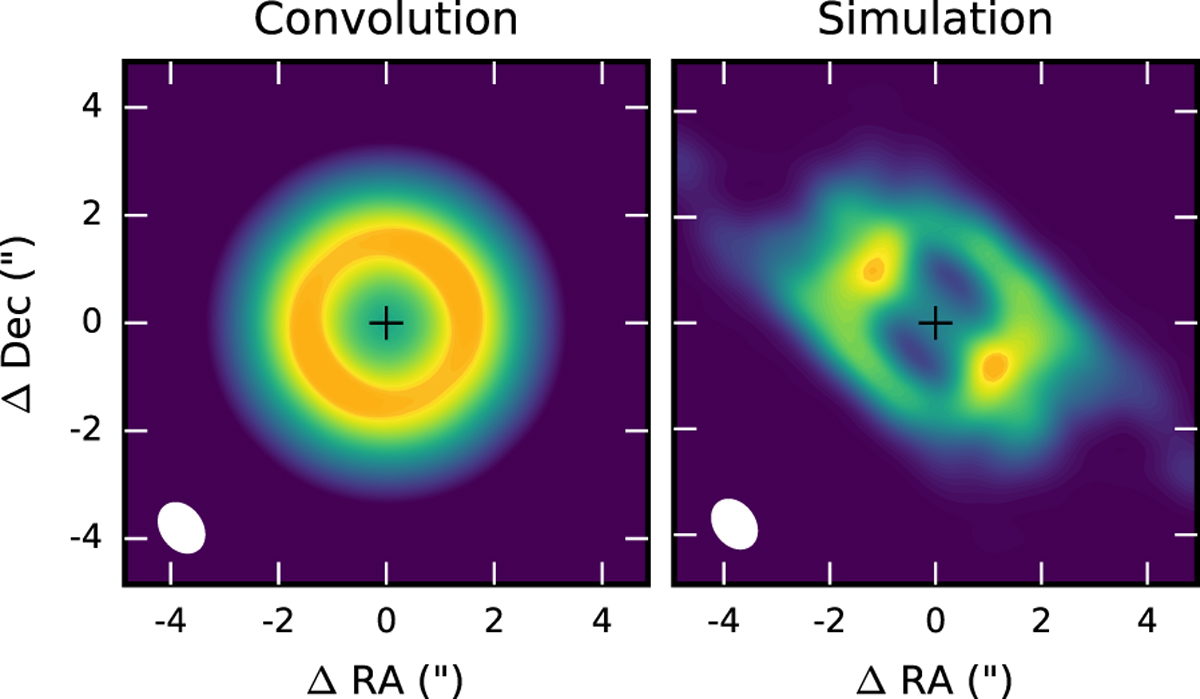
Fig. 3

Integrated intensity maps for a spherically symmetric ring-shaped H13CO+ distribution. Emission simulated with the radiative transfer code Ratran is convolved with the observed beam (left panel), and simulated with the (u, v) coverage of the NOEMA observations (right panel). The southern peak in the simulations is probably not observed owing to presence of water in the outflow (see text for details). The continuum peak is denoted with a cross, and the beam is shown in the bottom left corner.
Current usage metrics show cumulative count of Article Views (full-text article views including HTML views, PDF and ePub downloads, according to the available data) and Abstracts Views on Vision4Press platform.
Data correspond to usage on the plateform after 2015. The current usage metrics is available 48-96 hours after online publication and is updated daily on week days.
Initial download of the metrics may take a while.


