Fig. 2
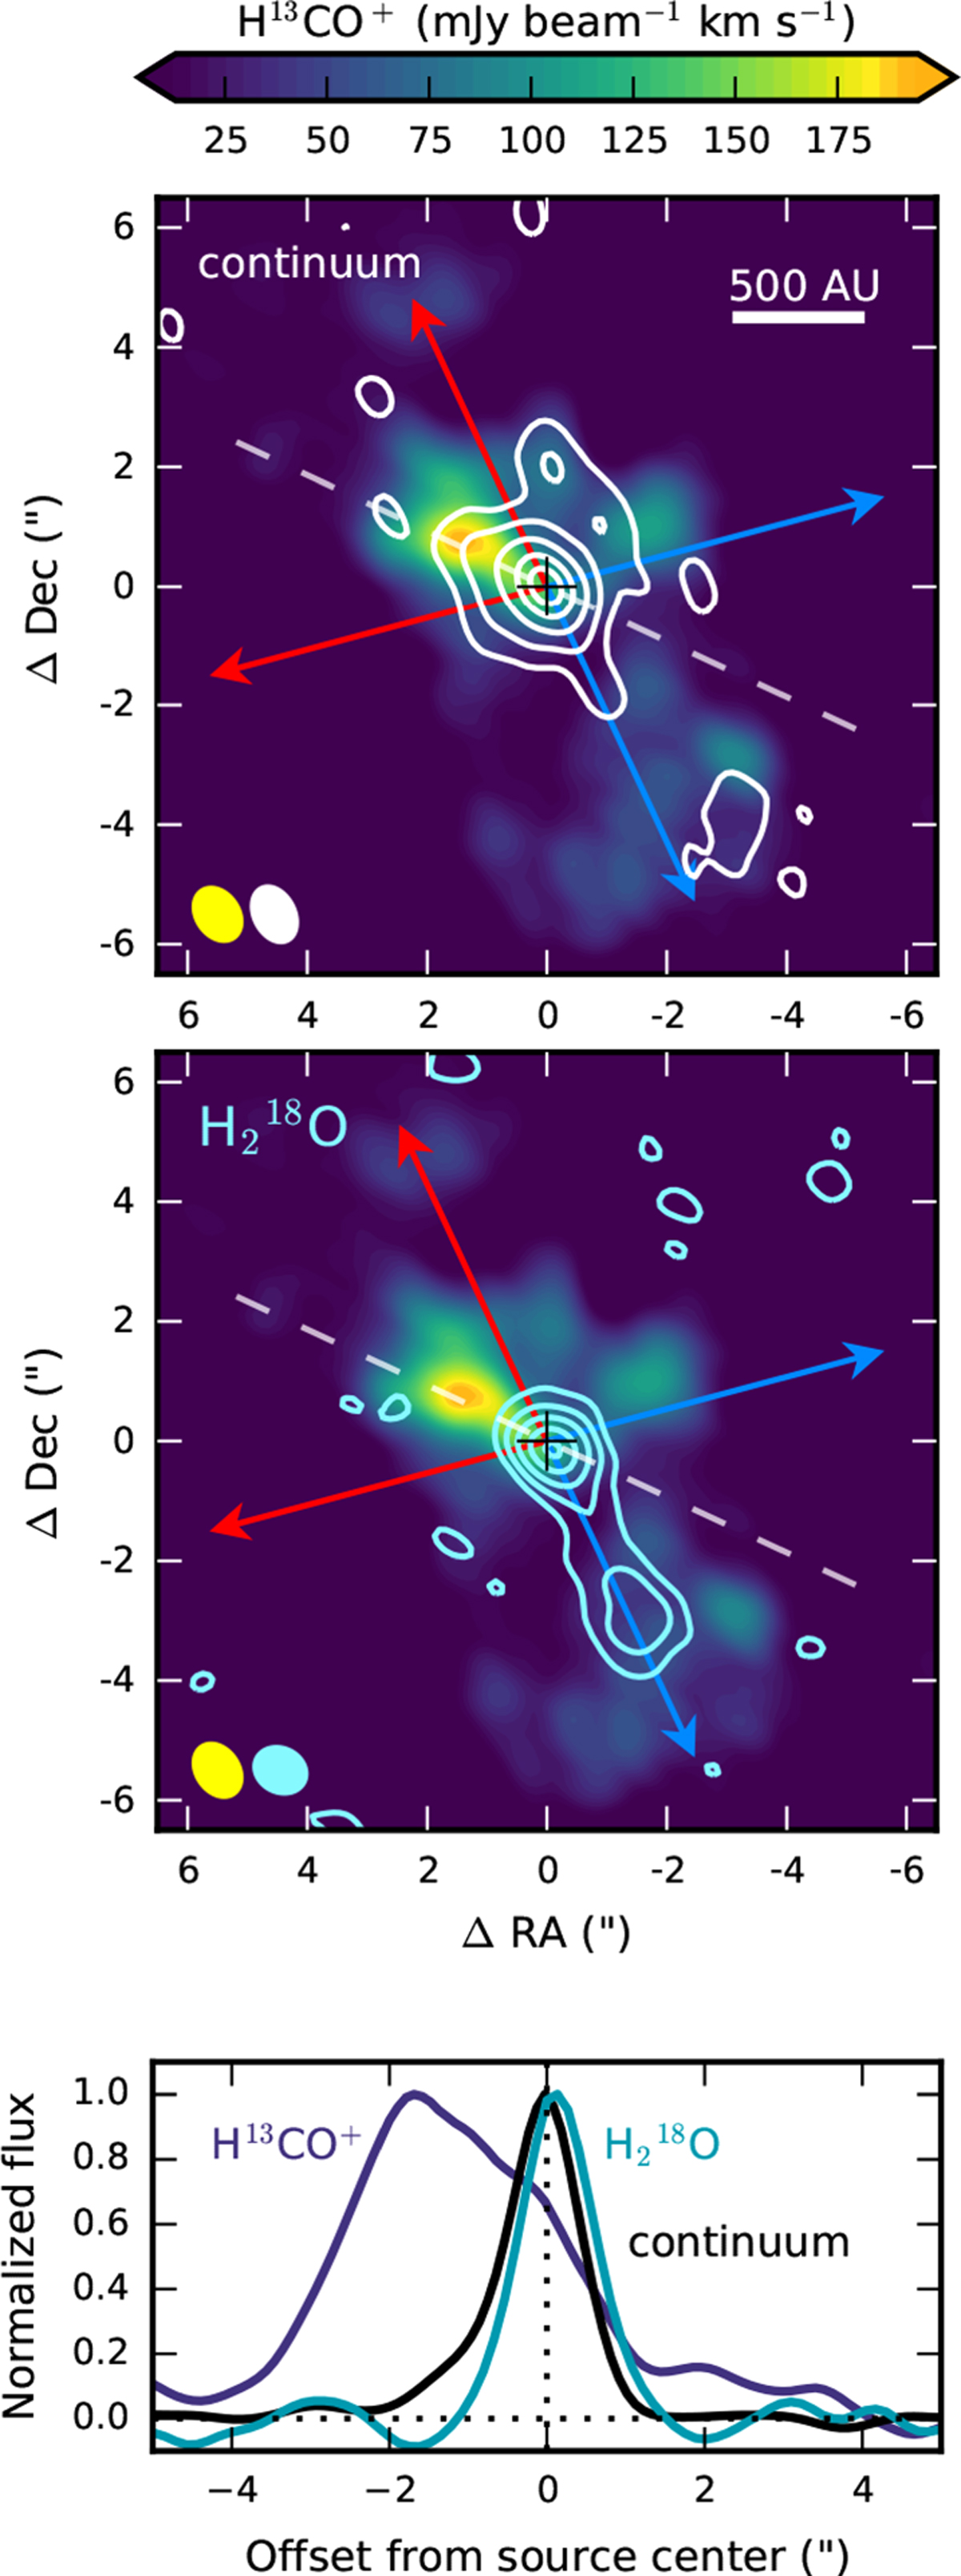
Integrated intensity map for the H13CO+ J = 3 − 2 transition (color scale) toward IRAS2A. The 1.2 mm continuum is overlaid in white contours (top panel) and the H![]() O 31,3 − 22,0 transition in blue contours (middle panel). The continuum contours are 1.8 (1σ) × [3, 10, 25, 50, 75] mJy beam−1, and the H
O 31,3 − 22,0 transition in blue contours (middle panel). The continuum contours are 1.8 (1σ) × [3, 10, 25, 50, 75] mJy beam−1, and the H![]() O contours are 9.8 (1σ) × [3, 8, 15, 25, 35] mJy beam−1 km s−1. The beams are depicted in the bottom left corner. The position of the continuum peak is indicated by a black cross (the close binaryis unresolved in these data) and the outflow axes by red and blue arrows. The integrated intensities along the dashed white line are shown in the bottom panel, normalized to their maximum value. The zero flux level and source position are indicated by dotted lines.
O contours are 9.8 (1σ) × [3, 8, 15, 25, 35] mJy beam−1 km s−1. The beams are depicted in the bottom left corner. The position of the continuum peak is indicated by a black cross (the close binaryis unresolved in these data) and the outflow axes by red and blue arrows. The integrated intensities along the dashed white line are shown in the bottom panel, normalized to their maximum value. The zero flux level and source position are indicated by dotted lines.
Current usage metrics show cumulative count of Article Views (full-text article views including HTML views, PDF and ePub downloads, according to the available data) and Abstracts Views on Vision4Press platform.
Data correspond to usage on the plateform after 2015. The current usage metrics is available 48-96 hours after online publication and is updated daily on week days.
Initial download of the metrics may take a while.