Fig. 1
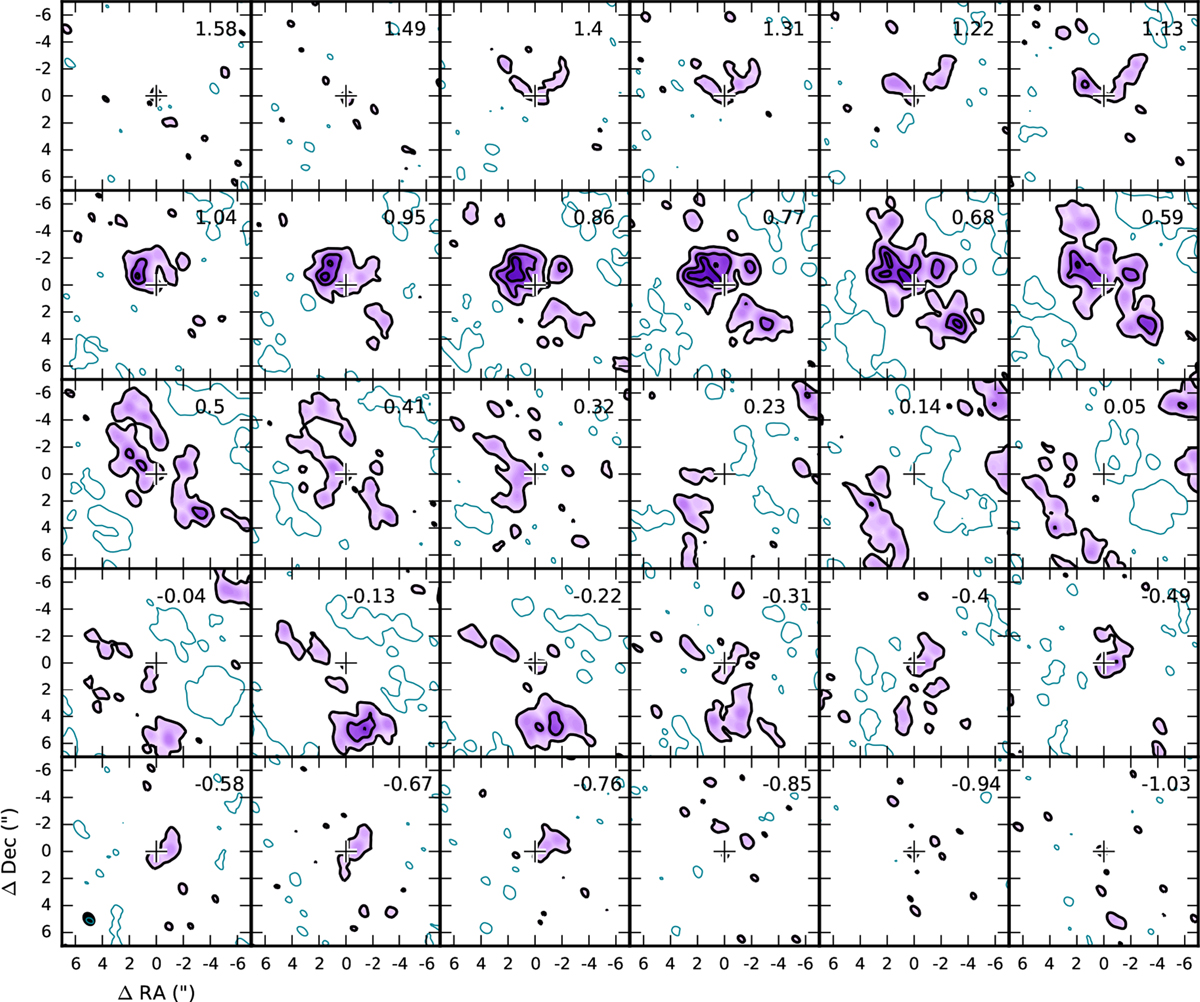
Channel maps for the H13CO+ J = 3 − 2 transition. Black contours are in steps of 10σ, starting from a 3σ level (30 mJy beam−1 in 0.09 km s−1 channels), and the −3σ contours are shown in blue. The peak intensity is 324 mJy beam−1 at 7.68 km s−1 (vlsr + 0.68 km s−1). The continuum peak position is indicated with a cross and the beam is shown in the bottom left corner of the bottom left panel. Channel velocities with respect to the systemic velocity of vlsr ≈ 7.0 km s−1 are listed in the top right corner of each panel. For the adopted distance to IRAS2A, 1′′ corresponds to 250 AU.
Current usage metrics show cumulative count of Article Views (full-text article views including HTML views, PDF and ePub downloads, according to the available data) and Abstracts Views on Vision4Press platform.
Data correspond to usage on the plateform after 2015. The current usage metrics is available 48-96 hours after online publication and is updated daily on week days.
Initial download of the metrics may take a while.