Fig. 7
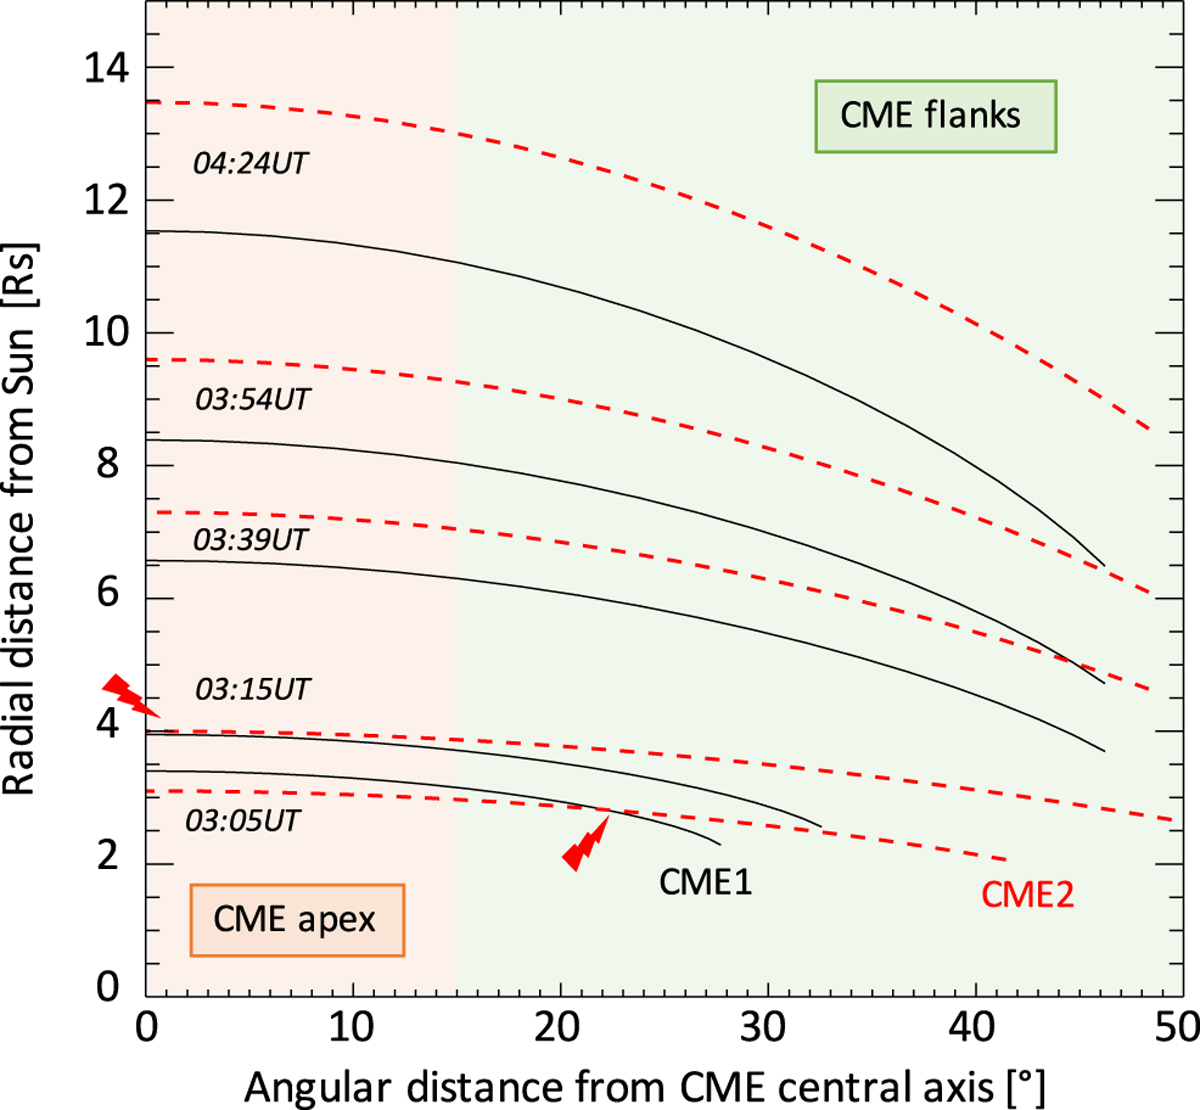
GCS model results (cf. Fig. 6) showing the heights of the reconstructed fronts ofCME1 (solid black) and CME2 (dashed red) as a function of their angular widths at five time steps according to the COR1 cadence. We defined the apex to cover an angle of 15° from the central axis, and the flanks to cover the angles larger than 15°. We note that the model results are symmetric, therefore only the half width is plotted.
Current usage metrics show cumulative count of Article Views (full-text article views including HTML views, PDF and ePub downloads, according to the available data) and Abstracts Views on Vision4Press platform.
Data correspond to usage on the plateform after 2015. The current usage metrics is available 48-96 hours after online publication and is updated daily on week days.
Initial download of the metrics may take a while.