Fig. 14
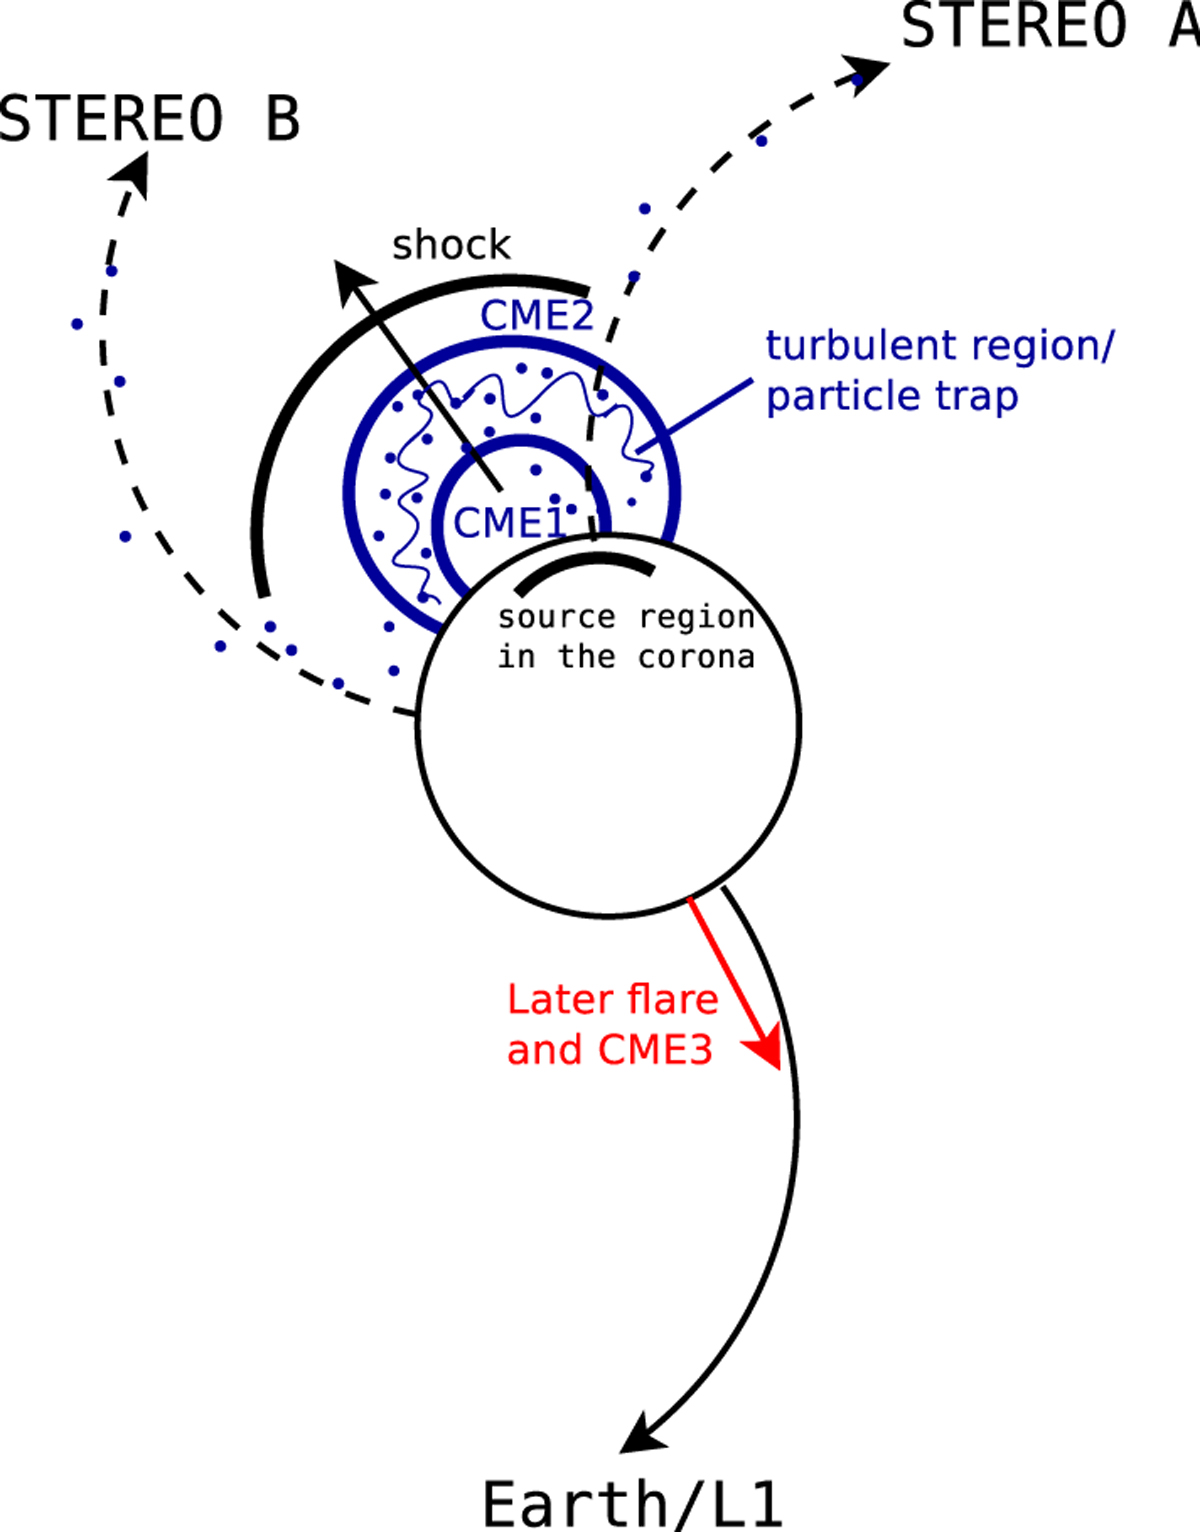
Cartoon illustrating the proposed scenario showing the longitudinal constellation of the two STEREO spacecraft and L1 with the turbulent region between CME1 and CME2 (blue) serving as a particle trap with steady particle leakage. The shock has already propagated through that region and is now driven in front of the merged CMEs. The red arrow marks the longitude of the later flare around 7 UT.
Current usage metrics show cumulative count of Article Views (full-text article views including HTML views, PDF and ePub downloads, according to the available data) and Abstracts Views on Vision4Press platform.
Data correspond to usage on the plateform after 2015. The current usage metrics is available 48-96 hours after online publication and is updated daily on week days.
Initial download of the metrics may take a while.