Fig. 13
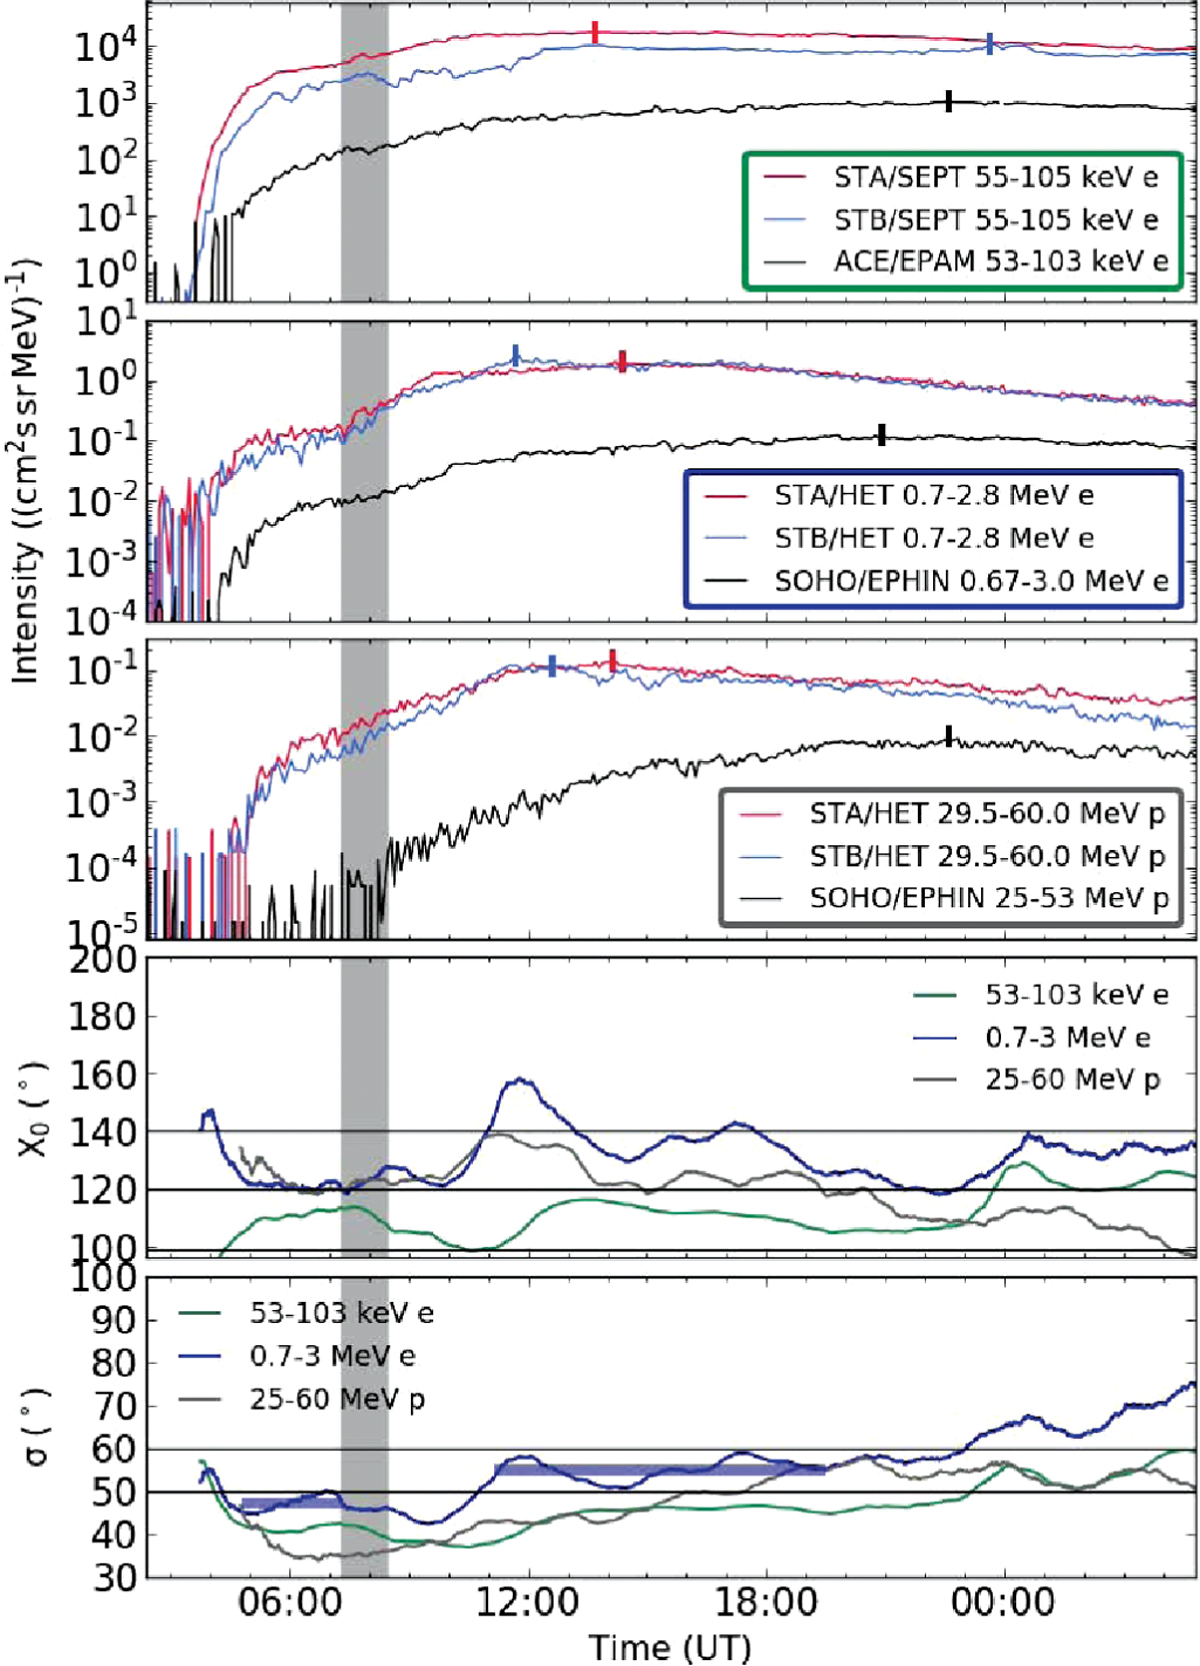
From top to bottom: first three panels: intensity time series of near-relativistic electrons, relativistic electrons, and ~30–60 MeV protons observed at STA (red), STB (blue), and SOHO or ACE (black) on 26 Dec 2013. Two panels below: center X0 and the standard deviation σ of a Gaussian function applied to the intensity measurements at each time step using a 1-h averaging window. The small vertical dashes in the top three panels represent the peak intensities taken to produce Fig. 12. The light blue bars inthe bottom panel denote the mean standard deviations of the relativistic electron distributions during the first and second components.
Current usage metrics show cumulative count of Article Views (full-text article views including HTML views, PDF and ePub downloads, according to the available data) and Abstracts Views on Vision4Press platform.
Data correspond to usage on the plateform after 2015. The current usage metrics is available 48-96 hours after online publication and is updated daily on week days.
Initial download of the metrics may take a while.