Fig. 12
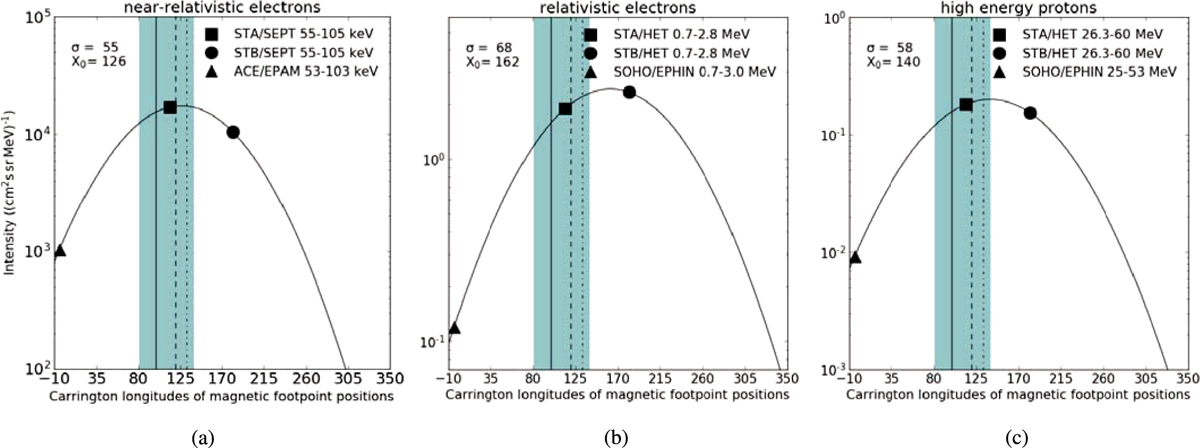
Longitudinal distribution of peak intensities of near-relativistic electrons (panel a), relativistic electrons (panel b), and >25 MeV protons (panel c) observed by STA (squares), STB (circles), and SOHO/ACE (triangles). The peak intensities are plotted as a function of the magnetic footpoint positions in Carrington longitudes determined by ballistic backmapping. The point of SOHO/ACE is plotted at −4° instead of 356° Carrington longitude to retain the correct ordering of the observers. A Gaussian function has been applied to the data points with its standard deviation σ and its center X0 provided in the top-left corners of each plot. The shaded range marks the longitudinal extent of the whole complex coronal event at the Sun. The solid vertical line marks the longitude of the main flare in region #2, the dashed line represents the longitude of the associated CME, and the dash-dotted line marks the longitude of the activity region #1.
Current usage metrics show cumulative count of Article Views (full-text article views including HTML views, PDF and ePub downloads, according to the available data) and Abstracts Views on Vision4Press platform.
Data correspond to usage on the plateform after 2015. The current usage metrics is available 48-96 hours after online publication and is updated daily on week days.
Initial download of the metrics may take a while.