Fig. 10
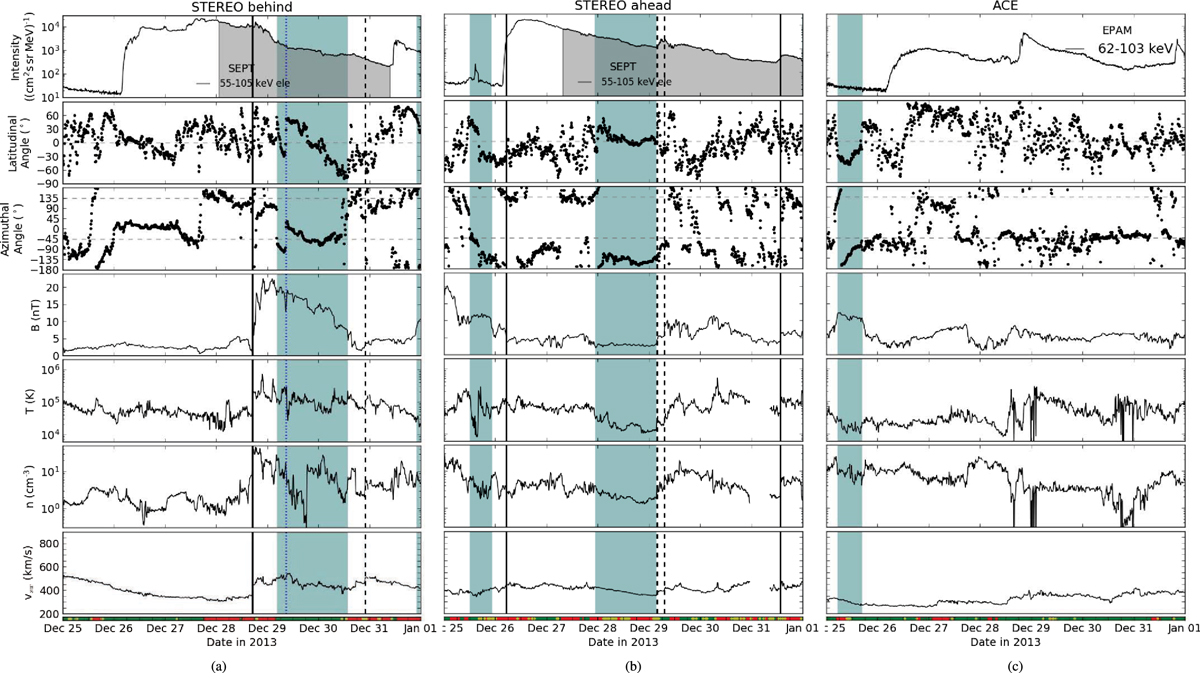
Solar wind plasma and magnetic field observations at STB (column a), STA (column b), and ACE (column c) from 25 December 2013 until 31 December 2013. From top to bottom: <100 keV electron intensities (gray shades mark periods of ion contamination), latitudinal, and azimuthal angles of the magnetic field, magnetic field strength, proton temperature, proton density, and solar-wind speed. The colored band below each plot represents the magnetic field polarity with red (green) showing inward (outward) polarity and yellow standing for uncertain polarity periods. The passages of ICME (ICME)s and shocks are marked by blue shaded ranges and lines (see text).
Current usage metrics show cumulative count of Article Views (full-text article views including HTML views, PDF and ePub downloads, according to the available data) and Abstracts Views on Vision4Press platform.
Data correspond to usage on the plateform after 2015. The current usage metrics is available 48-96 hours after online publication and is updated daily on week days.
Initial download of the metrics may take a while.