Fig. 1
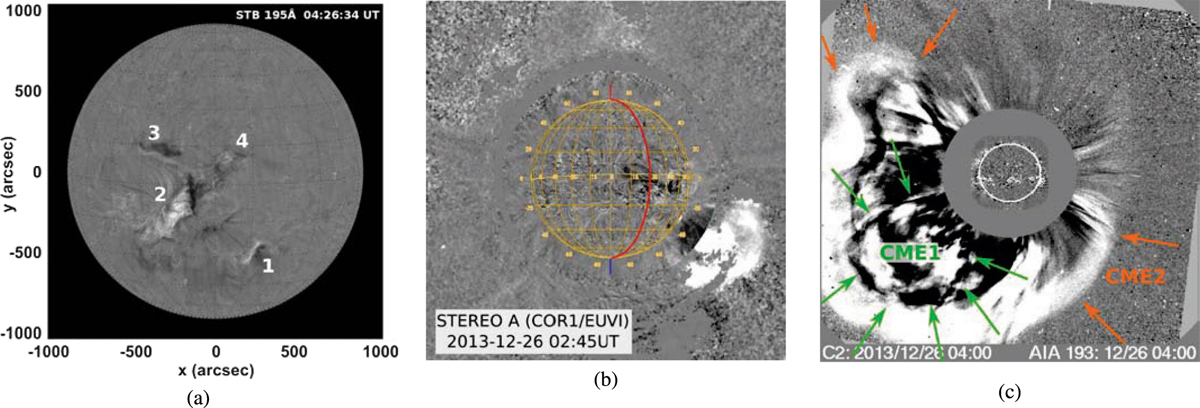
Panel a: STB/EUVI 195Å base difference image at 4:27 UT. The grid lines correspond to a 15° Carrington grid. The four regions of activity are marked by numbers. Panel b: combined EUVI and COR1 difference image taken by STA at 2:35 UT. Panel c: combined EUV and coronagraph difference images observed by SOHO/C2 and SDO/AIA at 4:00 UT. CME1 is marked by green arrows for the time when it is overtaken by CME2 (orange arrows).
Current usage metrics show cumulative count of Article Views (full-text article views including HTML views, PDF and ePub downloads, according to the available data) and Abstracts Views on Vision4Press platform.
Data correspond to usage on the plateform after 2015. The current usage metrics is available 48-96 hours after online publication and is updated daily on week days.
Initial download of the metrics may take a while.