Fig. 5
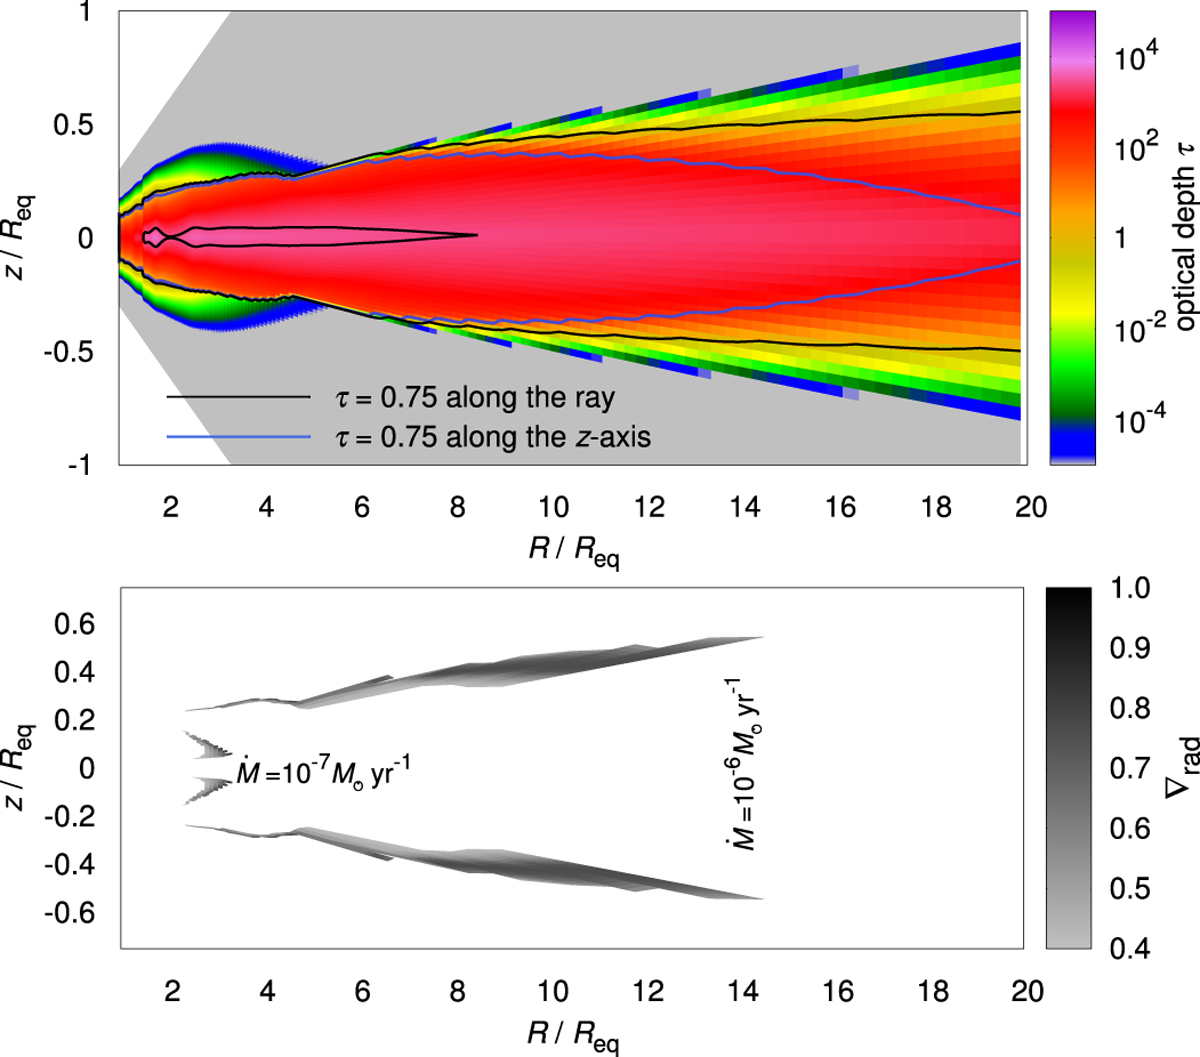
Upper panel: color map of the profile of the optical depth in the inner part (up to 20 stellar equatorial radii) of the dense circumstellar outflowing disk of a (near) critically rotating star with the same parameters as in Fig. 4. The optical depth is calculated using the method described in Appendix A.5. The outer black contour traces the optical depth level τ = 0.75 that is calculated along the line-of-sight from the stellar pole (described as “along the ray” in the figure legend), while the blue contour traces the same optical depth calculated along the vertical (z axis) direction. The inner black contour traces the optical depth level τ = 2500 that is calculated along the line-of-sight from the stellar pole. Lower panel: map of the convective zones with ∇rad > ∇ad on the same scale. The large zones refer to the disk mass-loss rate Ṁ = 10−6 M⊙ yr−1 while the small wings near the disk base refer to Ṁ = 10−7 M⊙ yr−1.
Current usage metrics show cumulative count of Article Views (full-text article views including HTML views, PDF and ePub downloads, according to the available data) and Abstracts Views on Vision4Press platform.
Data correspond to usage on the plateform after 2015. The current usage metrics is available 48-96 hours after online publication and is updated daily on week days.
Initial download of the metrics may take a while.