Fig. A.2
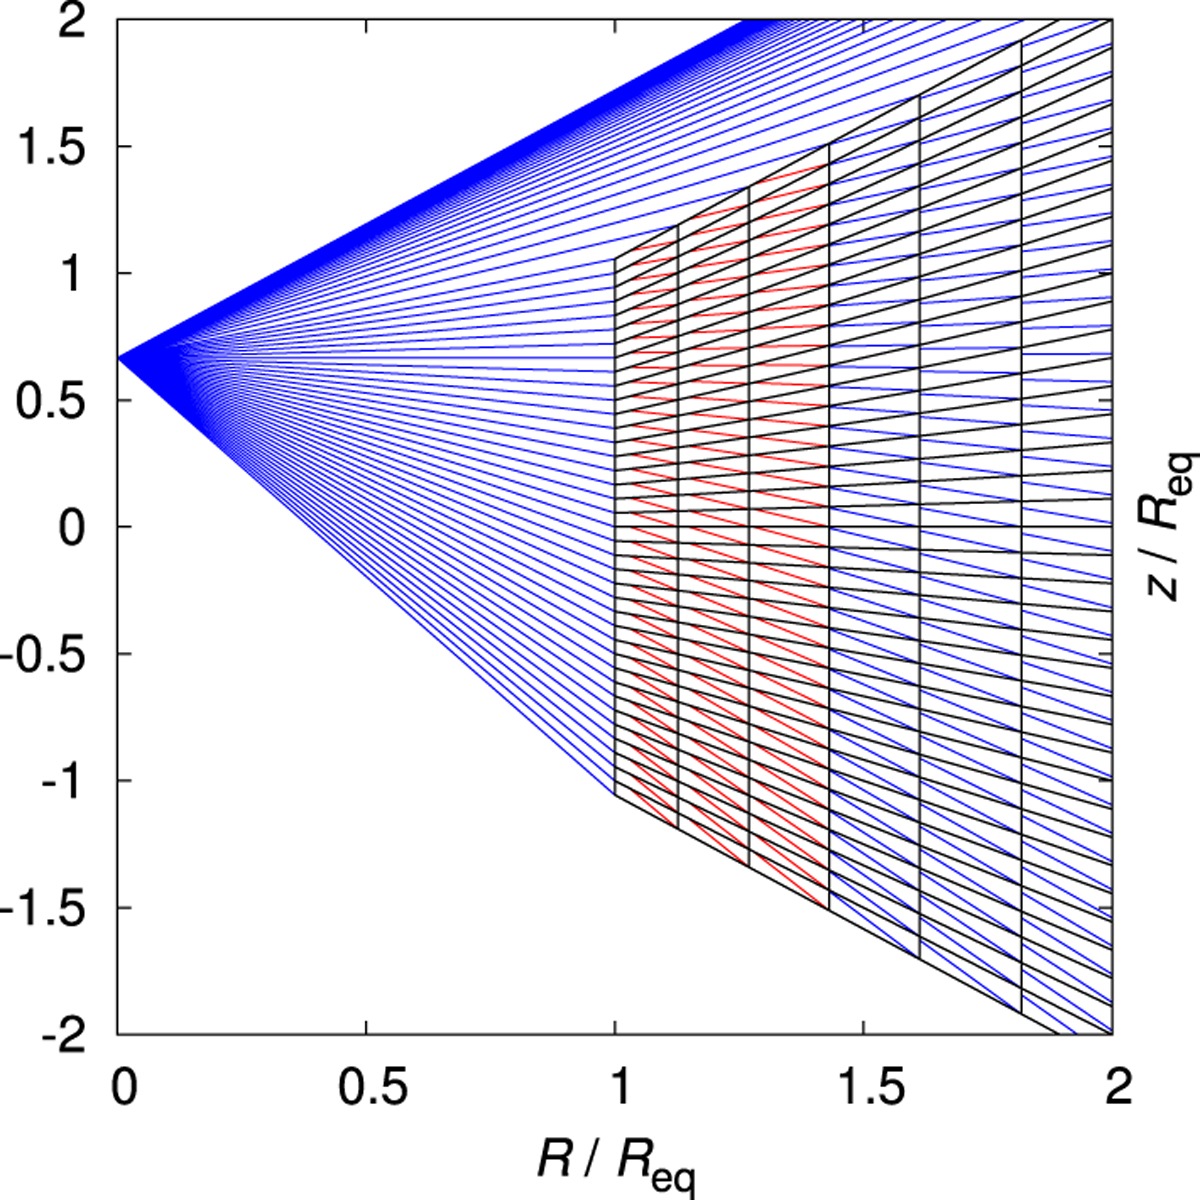
Schematic graph of the entirely inner part of the flaring disk grid in radial-vertical (R-θ) plane with marked ray-tracing for calculation of the disk optical depth. All the rays come from one point (from the “north” pole of a critically rotating star where Req = 1.5 R⋆). The grid cells are depicted as black lines, the blue rays intersect the vertical cell interfaces while the red lines enter the grid cells through their upper flaring interface (or the lower flaring interface for the not plotted rays that emerge from the stellar “south” pole). See Sect. A.5 for the description.
Current usage metrics show cumulative count of Article Views (full-text article views including HTML views, PDF and ePub downloads, according to the available data) and Abstracts Views on Vision4Press platform.
Data correspond to usage on the plateform after 2015. The current usage metrics is available 48-96 hours after online publication and is updated daily on week days.
Initial download of the metrics may take a while.