Fig. 2
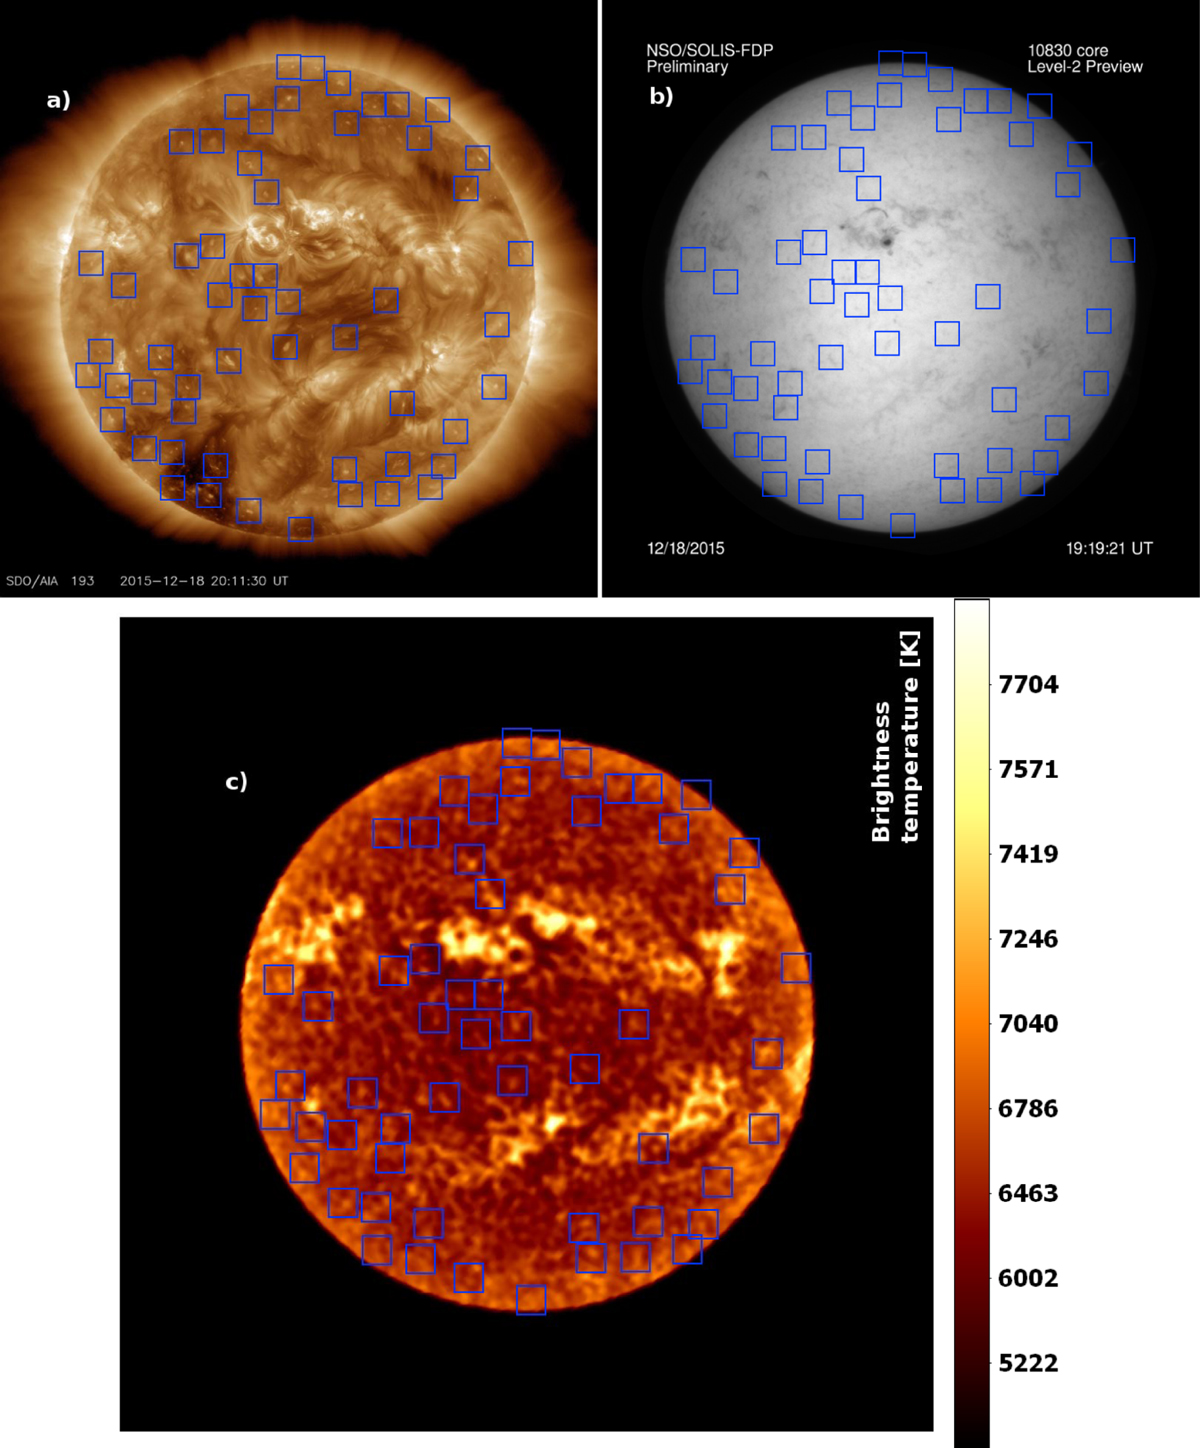
Image of the Sun taken at three different wavelengths on December 18, 2015, at the same time as Fig. 1. Coronal bright points are denoted with blue boxes which are at the same positions in all three images. Top left, a: SDO AIA 19.3 nm filtergram. Top right, b: NSO SOLIS He I 1083 nm core filtergram. Bottom, c: ALMA intensity map at 248 GHz (λ = 1.21 mm).
Current usage metrics show cumulative count of Article Views (full-text article views including HTML views, PDF and ePub downloads, according to the available data) and Abstracts Views on Vision4Press platform.
Data correspond to usage on the plateform after 2015. The current usage metrics is available 48-96 hours after online publication and is updated daily on week days.
Initial download of the metrics may take a while.