Fig. 1
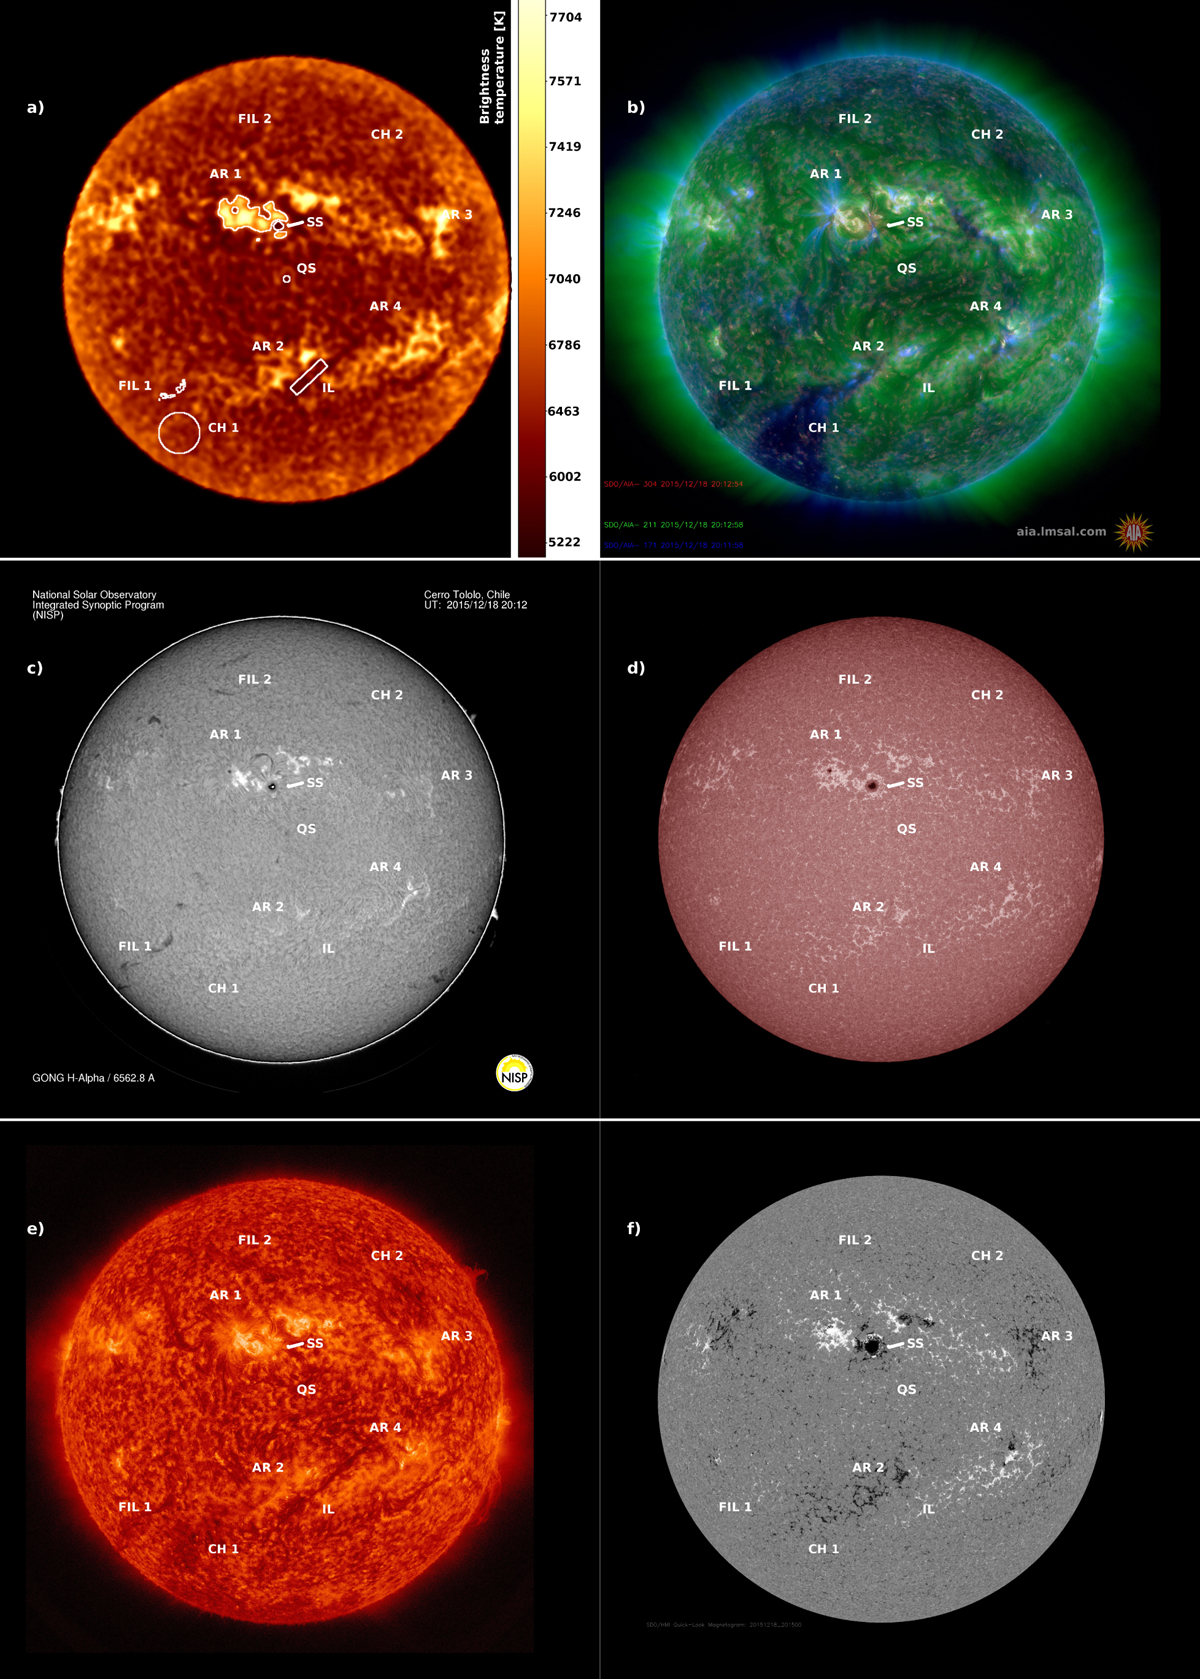
Image of the Sun from different instruments taken on December 18, 2015. Top left, a: ALMA intensity map at 248 GHz (λ = 1.21 mm, 20h 12m 21s). The brightness temperature in K is given on the intensity bar on the right. Top right, b: SDO composite image from AIA 30.4 nm, AIA 21.1 nm, AIA 17.1 nm instruments (20h 12m 58s UT). Middle left, c: Hα filtergram from Cerro Tololo Observatory, NISP (20h 12m UT). Middle right, d: SDO AIA 170.0 nm filtergram. Bottom left, e: SDO AIA 30.4 nm filtergram. Bottom right, f: SDO HMI magnetic field. Several regions of interest are encircled by white lines: AR indicates the position of active regions, FIL shows the position of filaments, SS shows the position of the sunspot, QS shows the position of the central quiet Sun region, IL indicates the position of magnetic inversion line, while CH are positions of coronal holes.
Current usage metrics show cumulative count of Article Views (full-text article views including HTML views, PDF and ePub downloads, according to the available data) and Abstracts Views on Vision4Press platform.
Data correspond to usage on the plateform after 2015. The current usage metrics is available 48-96 hours after online publication and is updated daily on week days.
Initial download of the metrics may take a while.