Fig. 4
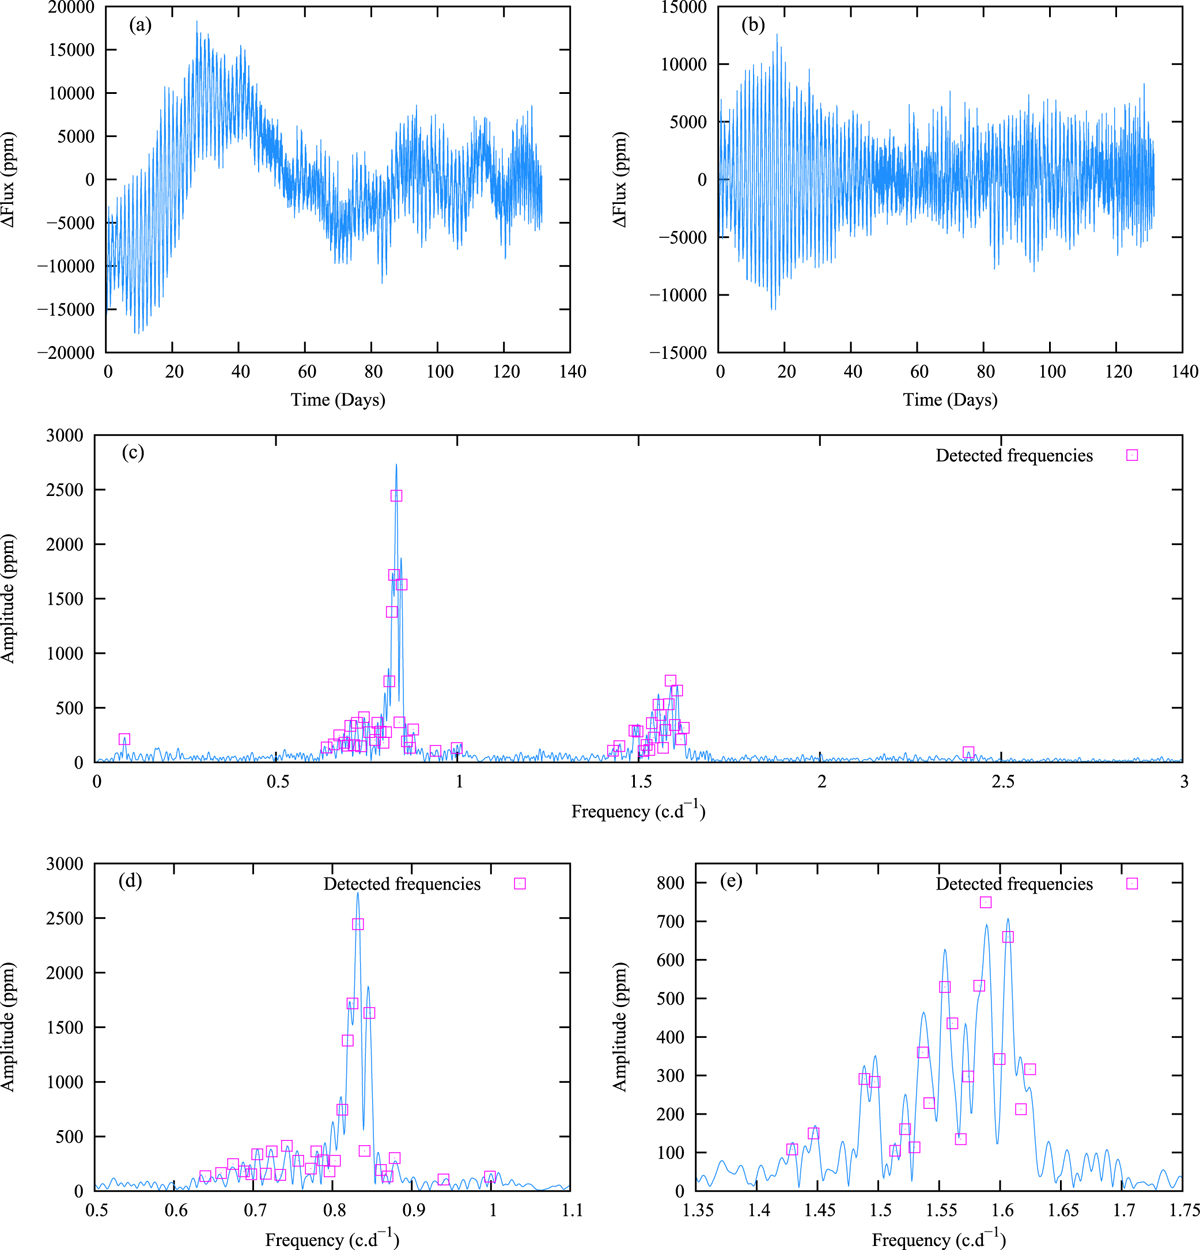
Frequency analysis of the Be star CoRoT 102672979 (star No 5) observed in the LRA1 run. Panel a: rectified light curve; panel b: rectified light curve corrected from the shape of the outburst. Panel c: DFT of the corrected light curve shown in (b); we note the low number of frequencies in group 1 ~ 0 c d−1; panel d: DFT zoomed on the second frequency group located at 0.8 c d−1; and panel e: DFT zoomed on the third frequency group located at 1.6 c d−1.
Current usage metrics show cumulative count of Article Views (full-text article views including HTML views, PDF and ePub downloads, according to the available data) and Abstracts Views on Vision4Press platform.
Data correspond to usage on the plateform after 2015. The current usage metrics is available 48-96 hours after online publication and is updated daily on week days.
Initial download of the metrics may take a while.