Fig. 23
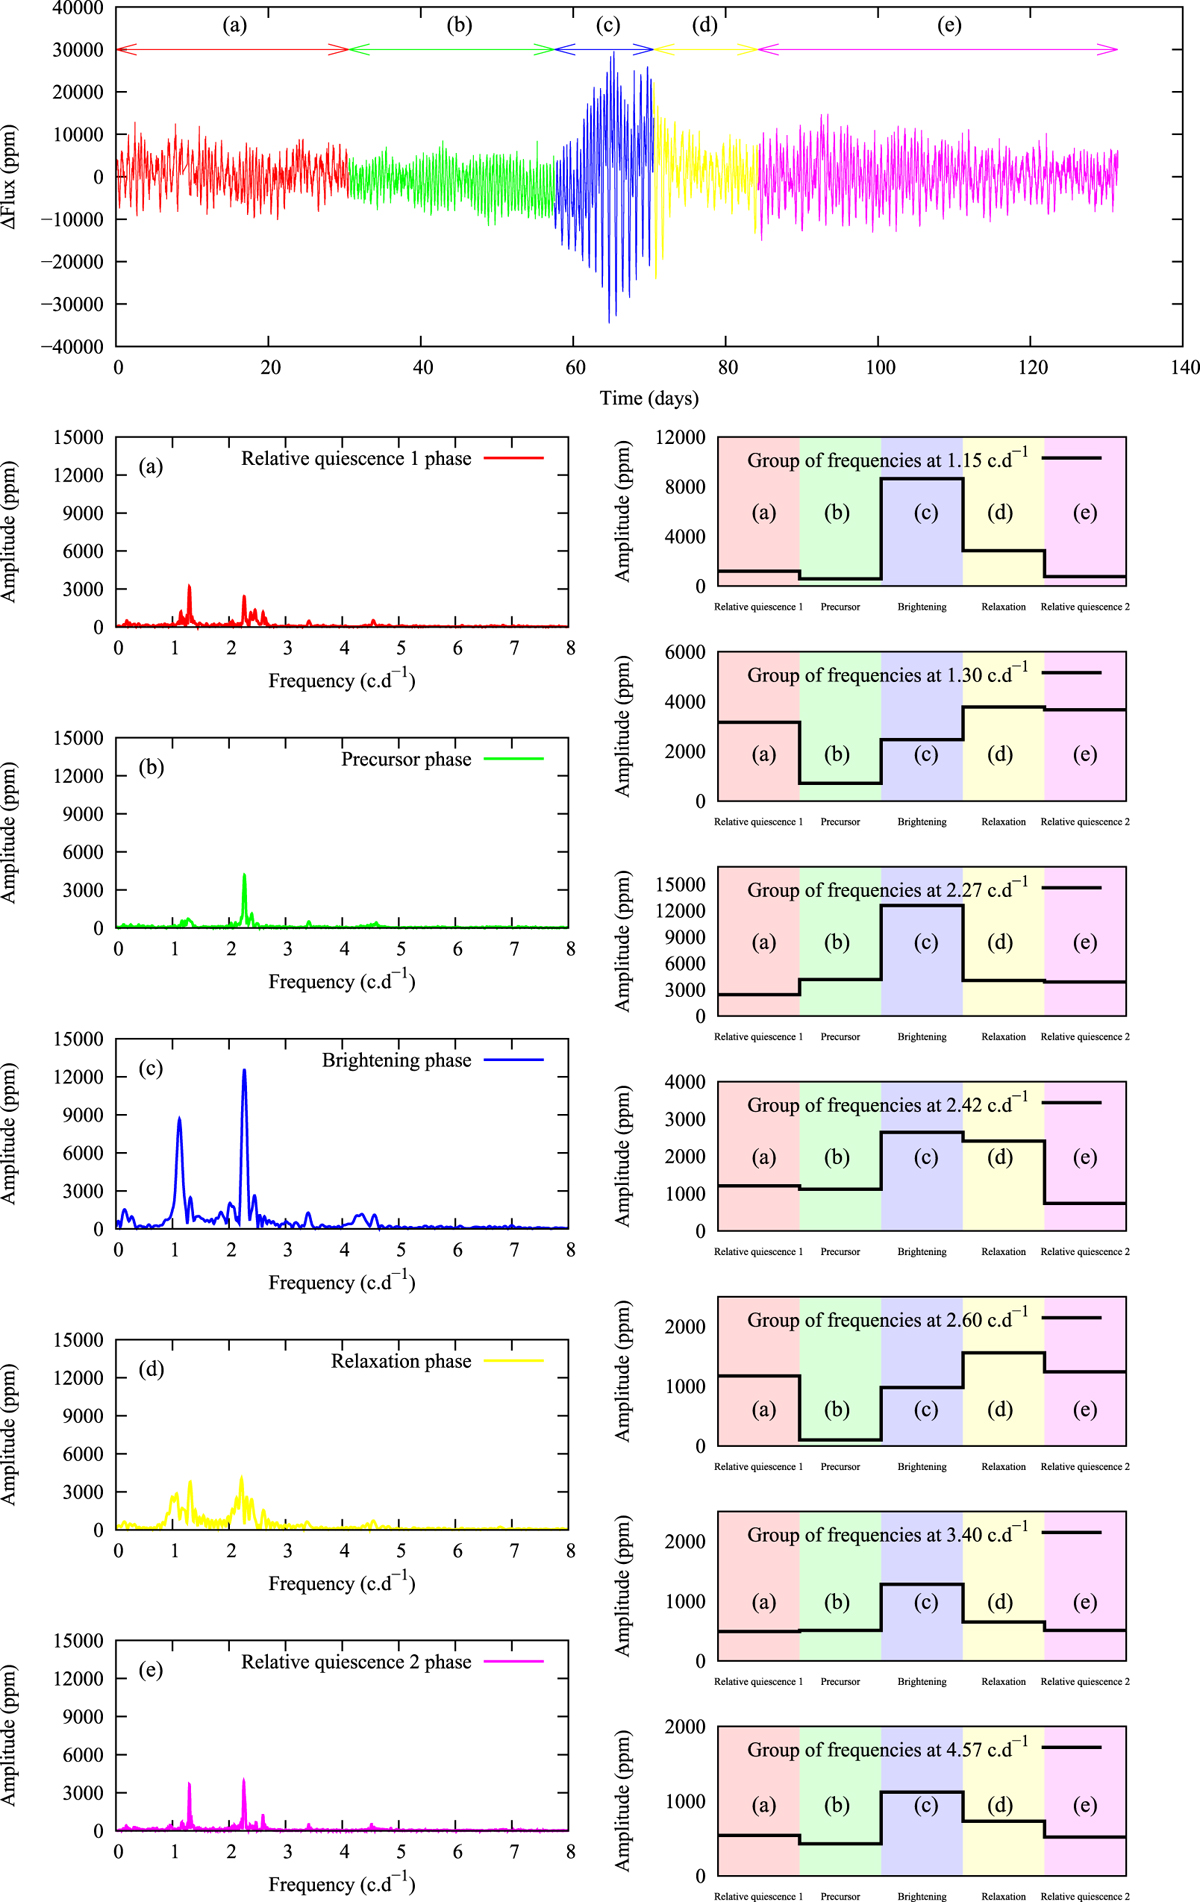
Similar as for Fig. 21, but for star CoRoT102686433 (star No 6) in the LRA1. Five phases are found in the light curve: (a) relative quiescent phase 1 ↔, (b) precursor phase ↔, (c) brightening phase ↔, (d) relaxation phase ↔, and (e) relative quiescent phase 2 ↔ (upper left panel). Changes in amplitude of the five groups of frequencies at 1.15, 1.30, 2.27, 2.42, 2.60, 3.40, and 4.57 c d−1 are seen between the different phases (right panels); errors of the amplitude estimates are ~ ±10% ppm on average. The behavior of the amplitudes of the two frequency groups at 1.30 and 2.60 c d−1 in relaxation phase (d) and the relative quiescent phases (a) and (e) differs from that of the other groups.
Current usage metrics show cumulative count of Article Views (full-text article views including HTML views, PDF and ePub downloads, according to the available data) and Abstracts Views on Vision4Press platform.
Data correspond to usage on the plateform after 2015. The current usage metrics is available 48-96 hours after online publication and is updated daily on week days.
Initial download of the metrics may take a while.