Fig. 22
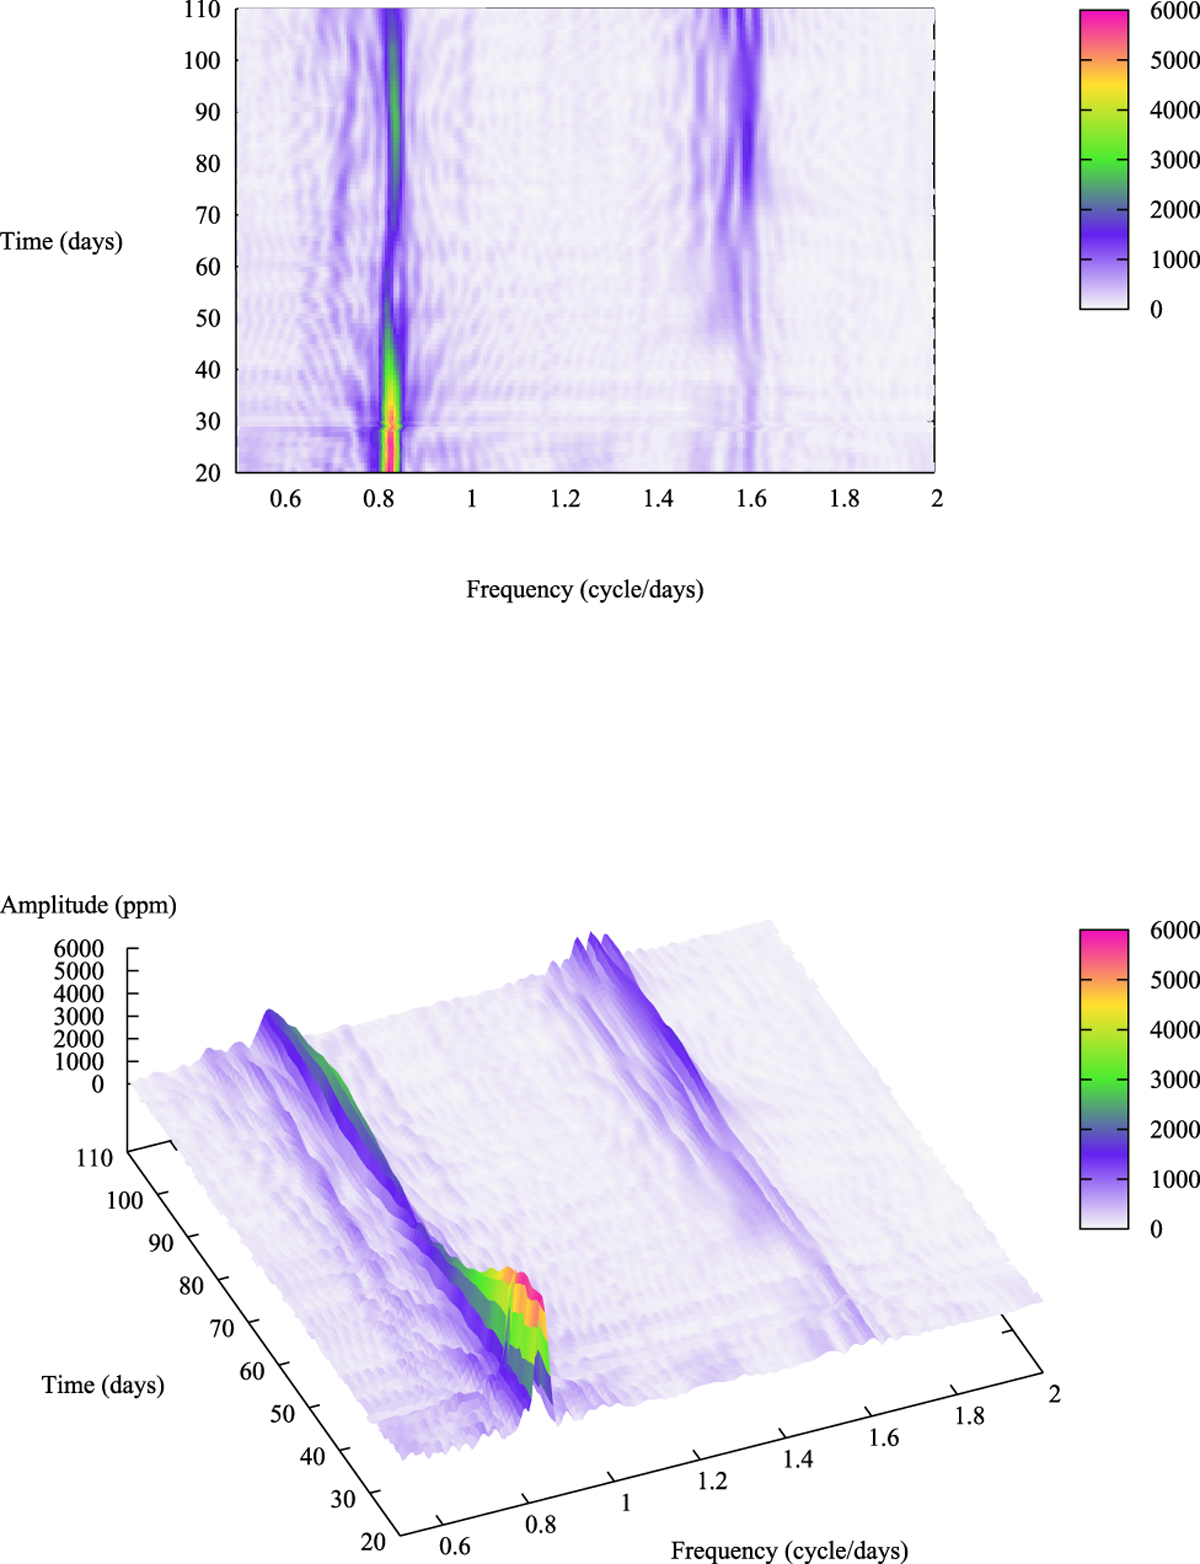
DFT evolution with time for the star CoRoT 102672979 (star No 5, in the LRA1) seen under different angles; this was made with a sliding 40-d window width and a 1-d constant step. The colors denote the amplitude of frequency peaks in ppm. The structure evolution of the two groups at 0.83 and 1.58 c d−1 is complex: amplitudes of frequencies vary through the whole light curve.
Current usage metrics show cumulative count of Article Views (full-text article views including HTML views, PDF and ePub downloads, according to the available data) and Abstracts Views on Vision4Press platform.
Data correspond to usage on the plateform after 2015. The current usage metrics is available 48-96 hours after online publication and is updated daily on week days.
Initial download of the metrics may take a while.